
- PRICING
- LIVE QUOTES
- LEARN
- HELP


EN
3 Stocks Estimated To Be Up To 47.6% Below Their Intrinsic Value
Over the last 7 days, the United States market has experienced a slight decline of 1.1%, but it has shown a robust rise of 12% over the past year, with earnings forecasted to grow by 17% annually. In this context, identifying stocks that are trading below their intrinsic value can present compelling opportunities for investors seeking to capitalize on potential growth within an improving market landscape.
Top 10 Undervalued Stocks Based On Cash Flows In The United States
| Name | Current Price | Fair Value (Est) | Discount (Est) |
| UiPath (PATH) | $13.63 | $25.32 | 46.2% |
| Provident Financial Services (PFS) | $23.16 | $42.96 | 46.1% |
| Pegasystems (PEGA) | $36.84 | $70.81 | 48% |
| Northeast Bank (NBN) | $132.54 | $247.38 | 46.4% |
| Futu Holdings (FUTU) | $109.82 | $211.78 | 48.1% |
| Civista Bancshares (CIVB) | $27.16 | $53.11 | 48.9% |
| Chagee Holdings (CHA) | $12.19 | $22.54 | 45.9% |
| Capital Bancorp (CBNK) | $36.33 | $66.91 | 45.7% |
| Autodesk (ADSK) | $220.31 | $417.61 | 47.2% |
| Addus HomeCare (ADUS) | $118.51 | $226.18 | 47.6% |
Let's explore several standout options from the results in the screener.
Addus HomeCare (ADUS)
Overview: Addus HomeCare Corporation offers personal care services to elderly, chronically ill, and disabled individuals in the United States, with a market cap of $2.12 billion.
Operations: The company's revenue segments include Hospice at $268.93 million, Home Health at $68.65 million, and Personal Care services totaling $1.14 billion.
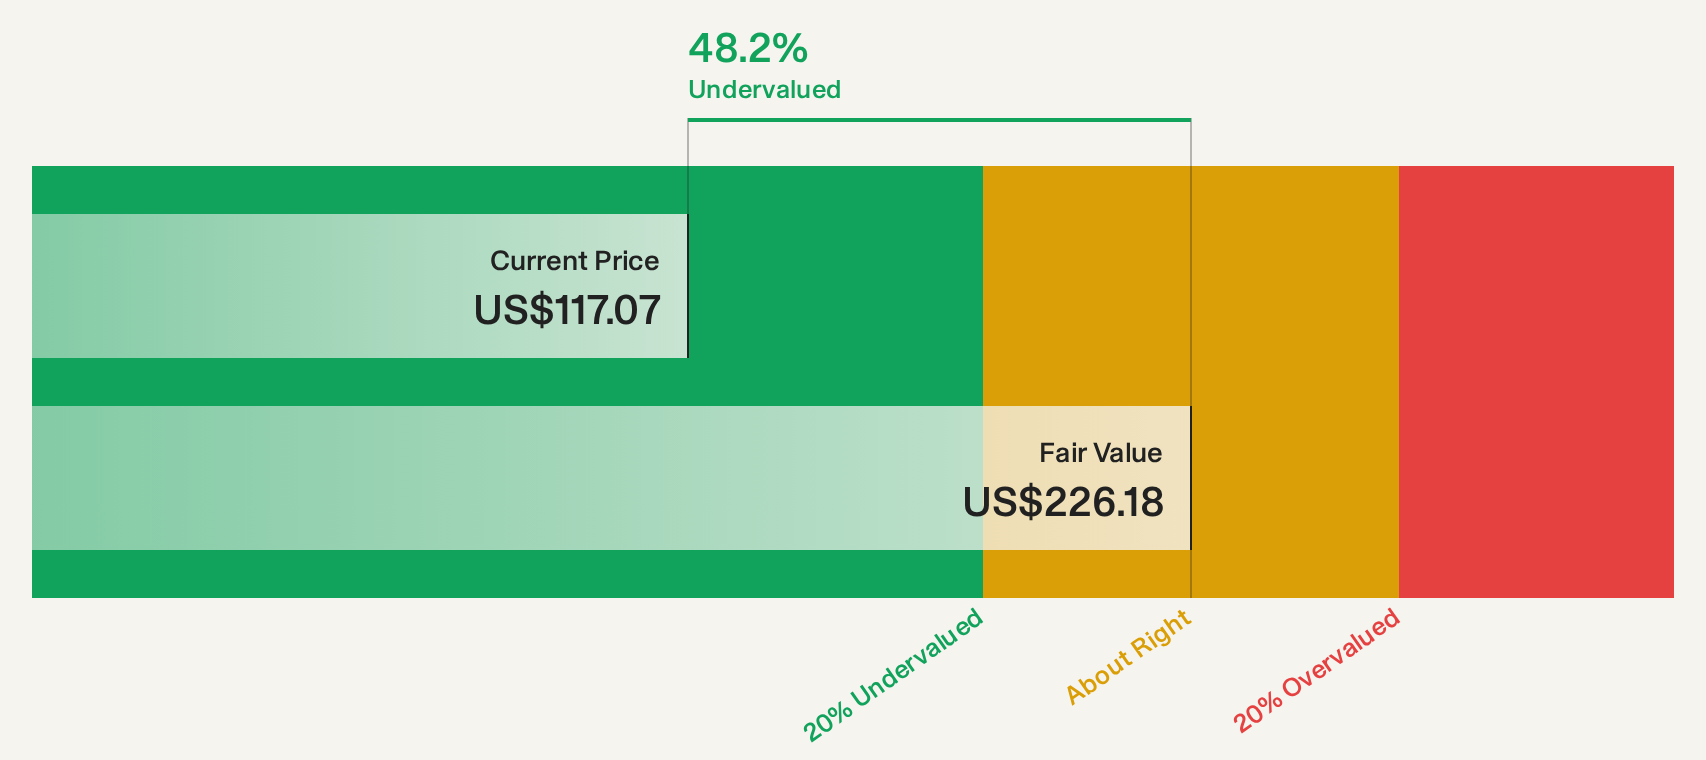
Estimated Discount To Fair Value: 47.6%
Addus HomeCare is trading at US$118.51, significantly below its estimated future cash flow value of US$226.18, indicating potential undervaluation. Despite moderate earnings growth forecasts of 9.75% annually and recent profit increases, revenue growth remains slower than the broader market at 5% per year. The company’s financial flexibility is bolstered by strong cash flows and reduced bank debt to US$64.3 million, supporting its acquisition strategy despite recent executive changes and index removals.
- The growth report we've compiled suggests that Addus HomeCare's future prospects could be on the up.
- Delve into the full analysis health report here for a deeper understanding of Addus HomeCare.
Interface (TILE)
Overview: Interface, Inc. designs, produces, and sells modular carpet products across various global markets with a market cap of approximately $1.99 billion.
Operations: The company's revenue is divided into two main segments: Americas (AMS) with $867.84 million and Europe, Africa, Asia, and Australia (EAAA) contributing $572.81 million.
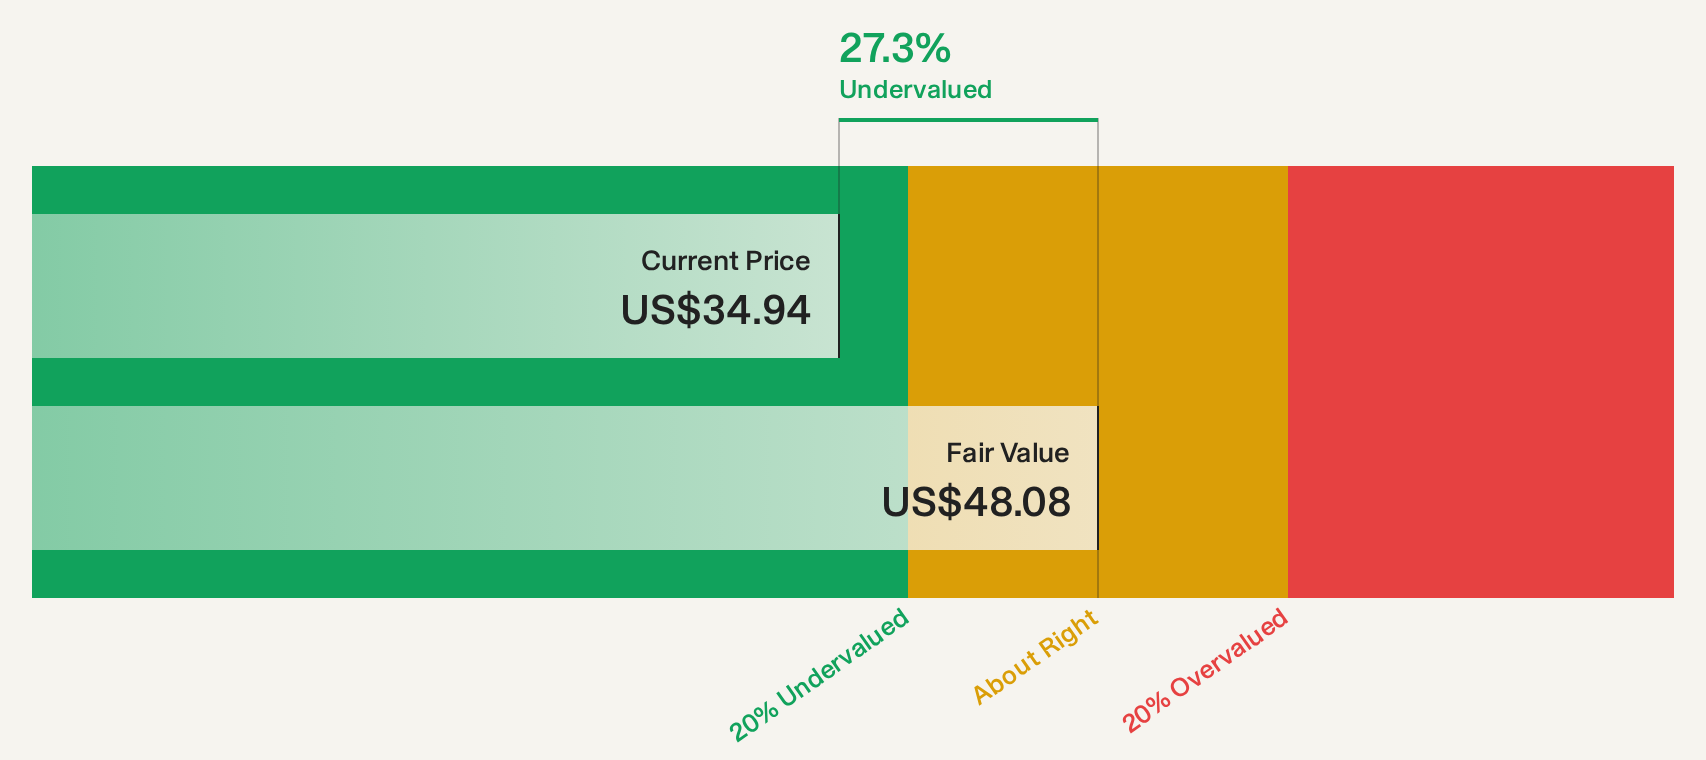
Estimated Discount To Fair Value: 27.9%
Interface is trading at US$34.66, notably below its estimated future cash flow value of US$48.08, suggesting potential undervaluation. Despite slower revenue and earnings growth forecasts compared to the broader market, recent earnings have surged by 49.7%. The company has completed a share buyback worth US$56.09 million and raised its annual sales guidance slightly, reflecting financial strength despite significant insider selling over the past three months.
- Our growth report here indicates Interface may be poised for an improving outlook.
- Click here to discover the nuances of Interface with our detailed financial health report.
Renasant (RNST)
Overview: Renasant Corporation is a bank holding company for Renasant Bank, offering financial, wealth management, and fiduciary services to retail and commercial clients, with a market cap of $3.74 billion.
Operations: The company's revenue is primarily derived from its Community Banks segment, which generated $1.05 billion, complemented by $40.65 million from Wealth Management services.
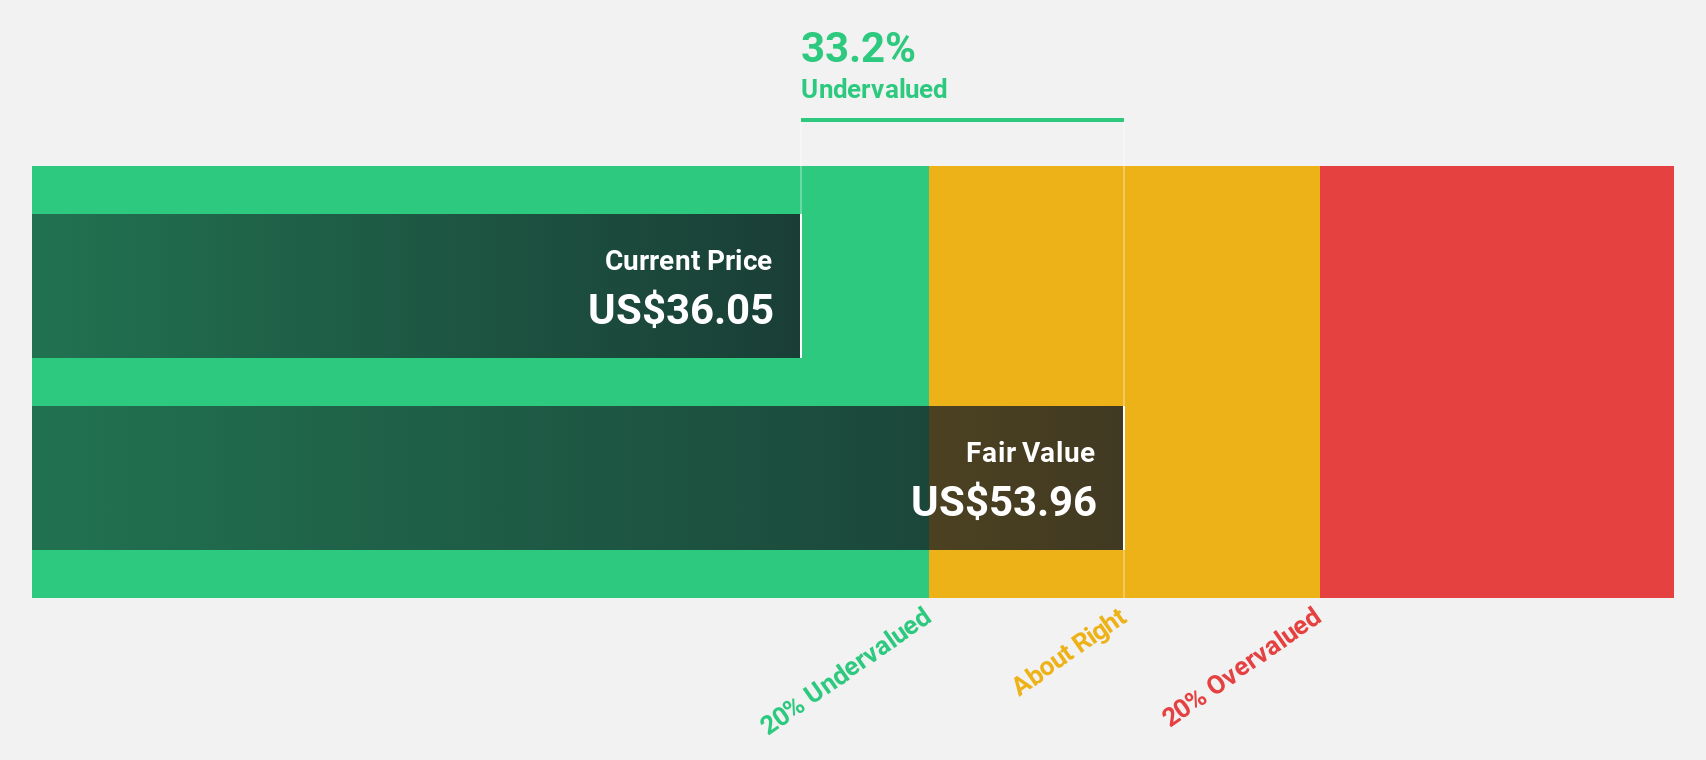
Estimated Discount To Fair Value: 25.5%
Renasant, trading at US$40.53, is valued below its future cash flow estimate of US$54.42, indicating potential undervaluation. While earnings and revenue growth forecasts trail the broader market, recent earnings have surged significantly with net income reaching US$87.09 million in Q2 2026 from US$1.02 million a year ago. The company maintains a reliable dividend and has completed significant share buybacks worth US$149.56 million despite notable insider selling recently.
- According our earnings growth report, there's an indication that Renasant might be ready to expand.
- Get an in-depth perspective on Renasant's balance sheet by reading our health report here.
Seize The Opportunity
- Explore the 46 names from our Undervalued US Stocks Based On Cash Flows screener here.
- Invested in any of these stocks? Simplify your portfolio management with Simply Wall St and stay ahead with our alerts for any critical updates on your stocks.
- Simply Wall St is a revolutionary app designed for long-term stock investors, it's free and covers every market in the world.
Ready For A Different Approach?
- Explore high-performing small cap companies that haven't yet garnered significant analyst attention.
- Diversify your portfolio with solid dividend payers offering reliable income streams to weather potential market turbulence.
- Fuel your portfolio with companies showing strong growth potential, backed by optimistic outlooks both from analysts and management.
This article by Simply Wall St is general in nature. We provide commentary based on historical data and analyst forecasts only using an unbiased methodology and our articles are not intended to be financial advice. It does not constitute a recommendation to buy or sell any stock, and does not take account of your objectives, or your financial situation. We aim to bring you long-term focused analysis driven by fundamental data. Note that our analysis may not factor in the latest price-sensitive company announcements or qualitative material. Simply Wall St has no position in any stocks mentioned.
Have feedback on this article? Concerned about the content? Get in touch with us directly. Alternatively, email editorial-team@simplywallst.com