
- PRICING
- LIVE QUOTES
- LEARN
- HELP


EN
TriNet Group (TNET), What Is Behind The Fresh Attention?
TriNet Group (TNET) reaffirmed its shareholder return policy, with the Board approving a US$0.29 per share dividend on September 11, 2026. The dividend is payable on October 26 to holders of record as of October 1.
TriNet Group shares trade at US$69.25, with a 90-day share price return of 51.93% and a 7-day share price return of 5.07%. The 1-year total shareholder return of 3.43% sits against weaker three- and five-year total shareholder returns that declined 38.16% and 23.91% respectively, suggesting recent momentum has picked up after a tougher longer-term stretch as management leans on dividends and other capital returns to support investors.
Spot opportunities beyond TriNet Group by scanning a curated 34 high quality undervalued stocks that features companies with stronger balance sheets and cash flows than their current prices might suggest.TriNet Group now trades slightly above analyst targets yet screens at a deep discount to estimated fair value. Is the recent share price surge a warning sign, or is the market catching up too slowly?
Most Popular Narrative: 8% Overvalued
TriNet Group closed at $69.25 against a widely followed fair value of $64.40. This frames the recent rally as richer than that narrative implies, while still anchored to detailed long term earnings and margin assumptions.
The analysts have a consensus price target of $64.4 for TriNet Group based on their expectations of its future earnings growth, profit margins and other risk factors.
Given the current share price of $68.37, the analyst price target of $64.4 is 6.2% lower. The relatively low difference between the current share price and the analyst consensus price target indicates that they believe on average, the company is fairly priced.
See why 1 investors see TriNet Group as 8% overvalued.
Result: Fair Value of $64.40 (OVERVALUED)
Still, TriNet Group faces pressure if healthcare costs run hotter than expected or if worksite employee volumes stay soft, which could undermine the current fair value story.
Find out about the key risks to this TriNet Group narrative.
Another View on TriNet Group Valuation
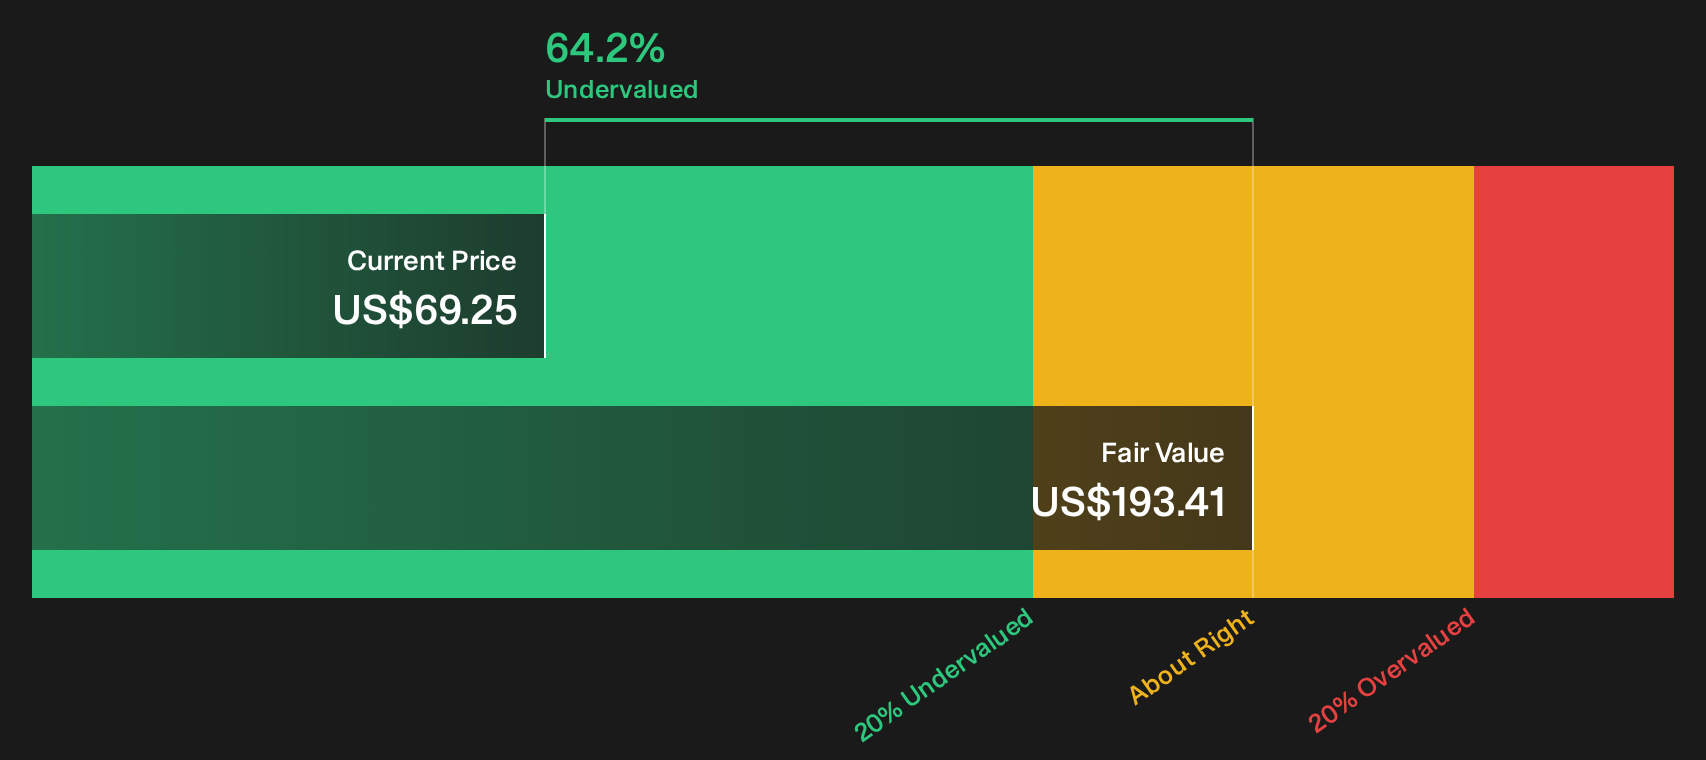
The first take paints TriNet Group as roughly 8% overvalued against a US$64.40 fair value. A second lens tells a different story. Our DCF model points to a future cash flow value of US$193.41 per share, which sits far above the current US$69.25 price. Which signal should matter more to you?
Look into how the SWS DCF model arrives at its fair value.
Next Steps
Mixed signals around TriNet Group valuation and risk can feel messy, so move fast and look through the underlying data yourself to make a call that actually fits your approach with 2 key rewards and 3 important warning signs
Looking for more ideas beyond TriNet Group?
TriNet Group offers one angle, but your portfolio deserves a wider bench. Use the Simply Wall St Screener to uncover fresh, data driven opportunities today.
- Target potential mispricings by scanning companies that combine strong cash flows with solid fundamentals using the 34 high quality undervalued stocks.
- Control risk more tightly by focusing on businesses that pass strict balance sheet checks with the list of solid balance sheet and fundamentals (22 results).
- Get in early on quality opportunities that attract less attention by running the 16 high quality undiscovered gems.
This article by Simply Wall St is general in nature. We provide commentary based on historical data and analyst forecasts only using an unbiased methodology and our articles are not intended to be financial advice. It does not constitute a recommendation to buy or sell any stock, and does not take account of your objectives, or your financial situation. We aim to bring you long-term focused analysis driven by fundamental data. Note that our analysis may not factor in the latest price-sensitive company announcements or qualitative material. Simply Wall St has no position in any stocks mentioned.
Have feedback on this article? Concerned about the content? Get in touch with us directly. Alternatively, email editorial-team@simplywallst.com