
- PRICING
- LIVE QUOTES
- LEARN
- HELP


EN
Hankyu Hanshin Holdings (TSE:9042), What Is Behind The Fresh Attention?
Hankyu Hanshin Holdings (TSE:9042) has recently drawn attention after its shares closed at ¥4,616, with the stock giving up ground over the past week while still showing gains over the past 3 months.
Short term momentum for Hankyu Hanshin Holdings has cooled, with the share price slipping over the past week. However, the roughly 15% year to date share price return and 5 year total shareholder return of about 43% still point to a longer record of value creation that investors are now reassessing through a more cautious lens.
Scan how Hankyu Hanshin Holdings compares with other transport and infrastructure plays by reviewing a curated 38 power grid technology and infrastructure stocks that could benefit from similar long-term capital cycles.
Hankyu Hanshin Holdings has already delivered a solid rebound, yet the recent pause leaves an open question: Is the meaningful upside still ahead, or has most of the easy gain already played out in the price?
Preferred P/E of 13.2x for Hankyu Hanshin Holdings: Is it justified?
On simple earnings maths, Hankyu Hanshin Holdings looks modestly priced, with a P/E of 13.2x against the broader JP market on 13.8x and a last close of ¥4,616 that already reflects a meaningful recovery in the share price.
The P/E ratio compares the current share price with annual earnings per share and shows how much investors are paying for each unit of profit. For a diversified transport and infrastructure group with businesses spanning rail, real estate, entertainment and logistics, this lens helps you see how the market is weighing steady cash generation and moderate profit growth.
Relative to its own earnings quality and growth profile, the current valuation implies the market is not paying a premium for recent progress. Forecast earnings growth of 4.8% per year sits below the wider JP market on 8.8%, and return on equity is described as low at 7.2% and still expected to remain subdued, so a restrained earnings multiple can be read as investors keeping expectations in check. At the same time, the estimated fair P/E of 16.8x sits well above the current 13.2x, which suggests there may be room for the valuation multiple to shift higher if sentiment or fundamentals improve.
Against the JP Transportation industry average P/E of 12.3x, Hankyu Hanshin Holdings trades on a higher multiple, which indicates investors are currently willing to pay more for its earnings than for sector peers.
Explore the SWS fair ratio for Hankyu Hanshin Holdings.
Result: Price-to-earnings of 13.2x (ABOUT RIGHT)
Still, Hankyu Hanshin Holdings relies heavily on Japan for revenue and carries exposure to cyclical areas like travel and entertainment, which can quickly pressure earnings expectations.
Find out about the key risks to this Hankyu Hanshin Holdings narrative.
Another View on Hankyu Hanshin Holdings
The P/E story makes Hankyu Hanshin Holdings look fairly reasonable, yet the SWS DCF model points the other way. On that cash flow lens, an estimated value of ¥2,820.38 per share versus the current ¥4,616 screen price flags the stock as overvalued on this method.
That kind of gap raises a practical question for you as an investor: Is the market correctly pricing assets that a cash flow model treats as lower value, or is the model missing something about how this group earns and reinvests its money over time?
Look into how the SWS DCF model arrives at its fair value.
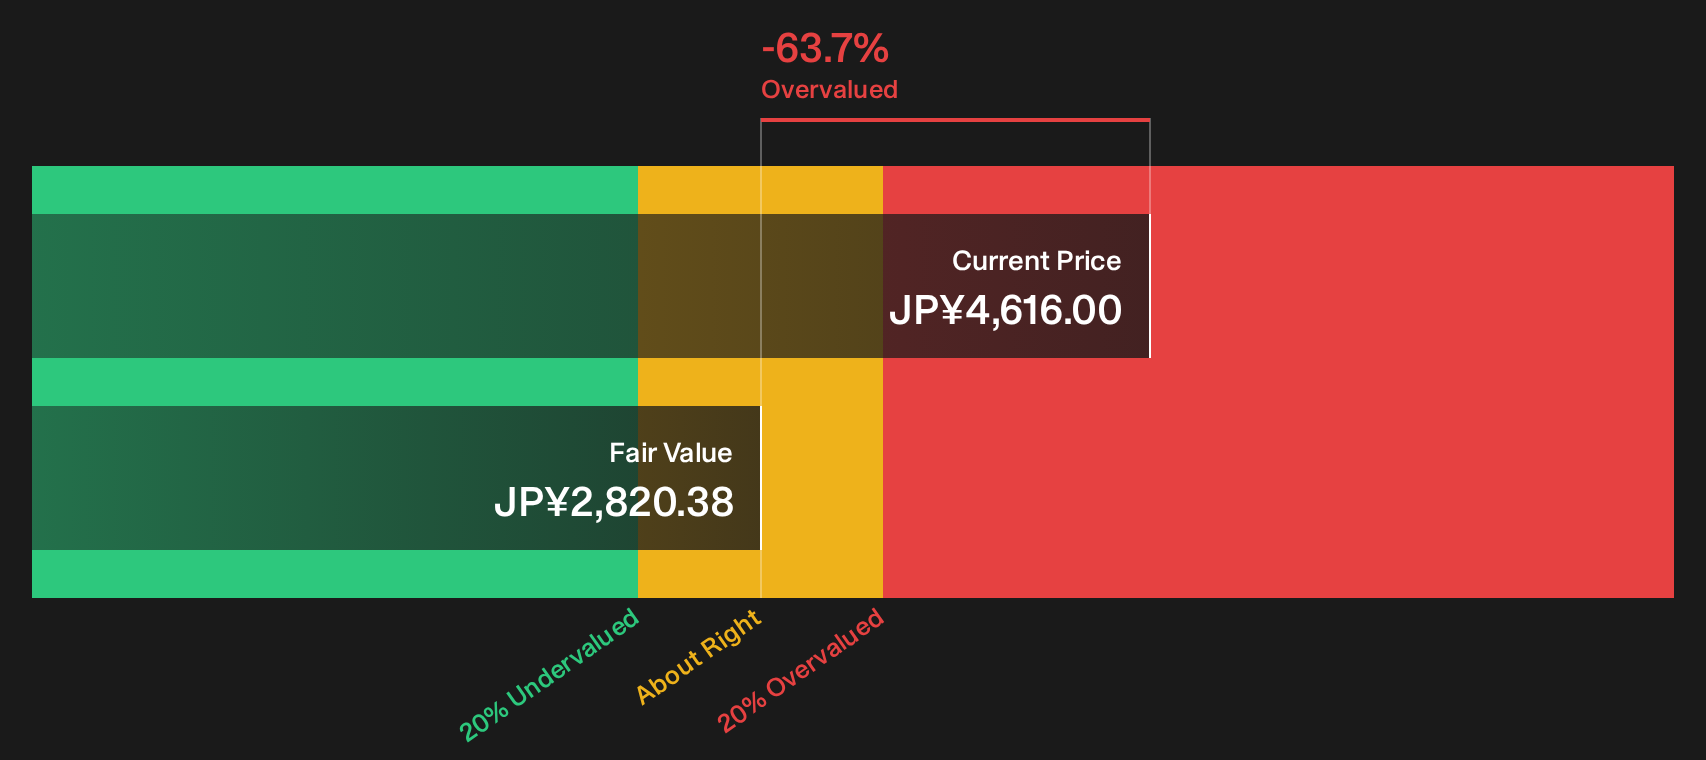
Simply Wall St performs a discounted cash flow (DCF) on every stock in the world every day (check out Hankyu Hanshin Holdings for example). We show the entire calculation in full. You can track the result in your watchlist or portfolio and be alerted when this changes, or use our stock screener to discover 18 high quality undervalued stocks. If you save a screener we even alert you when new companies match - so you never miss a potential opportunity.
Next Steps
Mixed signals on Hankyu Hanshin Holdings so far. If you want your view to move faster than the next headline, weigh both sides of the story and test the balance of 3 key rewards and 2 important warning signs.
Looking for more ideas beyond Hankyu Hanshin Holdings?
If Hankyu Hanshin Holdings has you thinking harder about value and risk, broaden your watchlist with a few focused screeners built to surface clear opportunities.
- Target resilient compounding potential by scanning a 18 high quality undervalued stocks that pairs quality fundamentals with pricing that still looks restrained.
- Prioritise capital preservation by reviewing a 12 resilient stocks with low risk scores that filters for sturdier balance sheets and calmer share price behaviour.
- Get ahead of the crowd by checking a 74 high quality undiscovered gems that highlights quieter companies with solid metrics before attention fully arrives.
This article by Simply Wall St is general in nature. We provide commentary based on historical data and analyst forecasts only using an unbiased methodology and our articles are not intended to be financial advice. It does not constitute a recommendation to buy or sell any stock, and does not take account of your objectives, or your financial situation. We aim to bring you long-term focused analysis driven by fundamental data. Note that our analysis may not factor in the latest price-sensitive company announcements or qualitative material. Simply Wall St has no position in any stocks mentioned.
Have feedback on this article? Concerned about the content? Get in touch with us directly. Alternatively, email editorial-team@simplywallst.com