
- PRICING
- LIVE QUOTES
- LEARN
- HELP


EN
Discover 3 Global Penny Stocks With Market Caps Over US$20M
Amidst escalating geopolitical tensions and rising oil prices, global markets have faced downward pressure, with major indices reflecting investor concerns over inflation and monetary policy shifts. In such a volatile landscape, identifying stocks that balance potential growth with financial resilience is crucial. Penny stocks, though often overlooked as a niche investment category, can still provide intriguing opportunities when backed by robust financials. This article will explore several penny stocks that demonstrate promising attributes for investors seeking under-the-radar companies poised for long-term success.
Let's uncover some gems from our specialized screener.
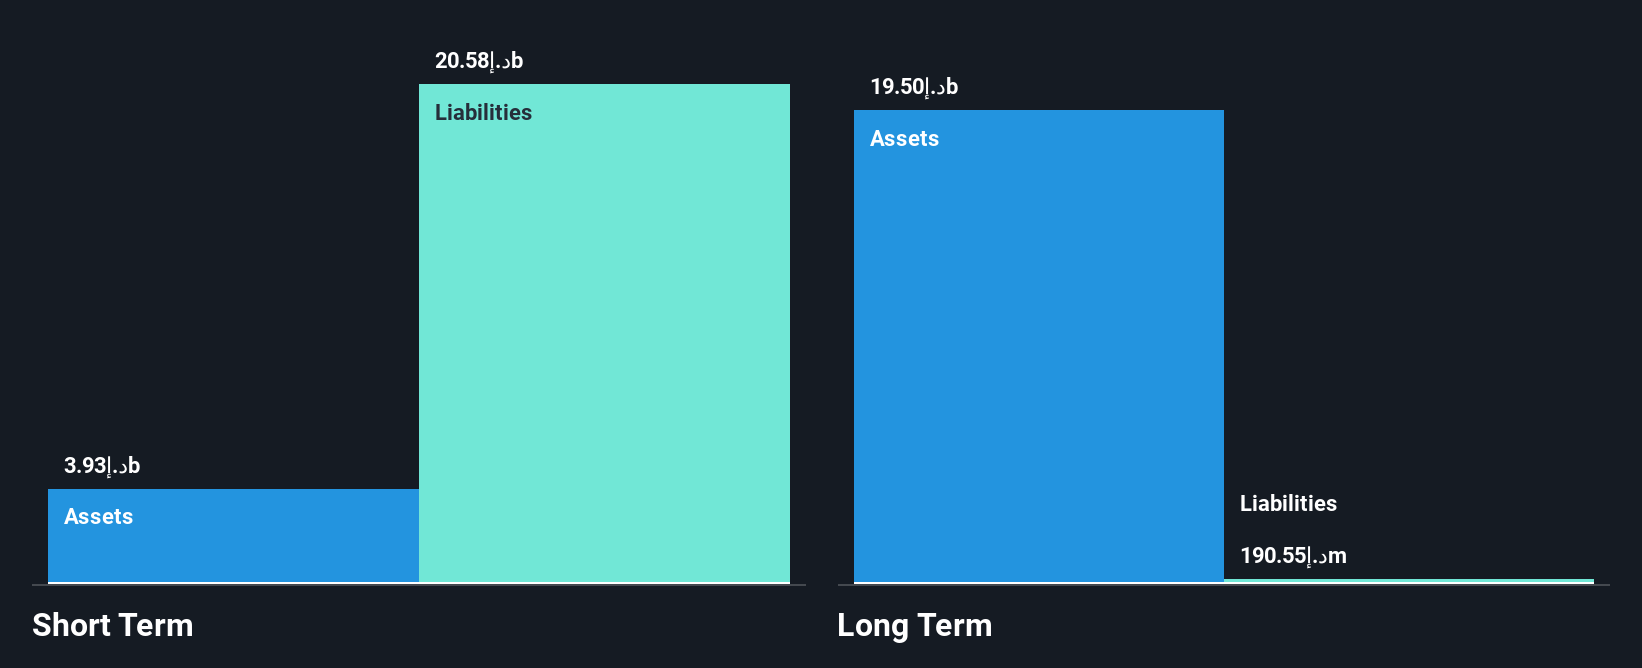
United Arab Bank P.J.S.C (ADX:UAB)
Simply Wall St Financial Health Rating: ★★★★☆☆
Overview: United Arab Bank P.J.S.C. offers commercial banking products and services to individual and corporate customers in the United Arab Emirates, with a market cap of AED4.18 billion.
Operations: The company's revenue is primarily derived from Corporate Banking at AED542.89 million, followed by Treasury and Capital Markets at AED250.83 million, and Personal Banking at AED62.83 million.
Market Cap: AED4.18B
United Arab Bank P.J.S.C. has shown stable financial performance with net interest income rising to AED 316.52 million for the first half of 2026, compared to AED 275.19 million a year ago, and earnings growth of 16.5% over the past year surpassing industry averages. The bank maintains high-quality earnings and a low Price-To-Earnings ratio of 9.7x, indicating good value relative to the market average of 10.7x. With an experienced board and appropriate asset management reflected in its Assets to Equity ratio (6.9x), UAB demonstrates solid fundamentals despite a high level of bad loans at 2.7%.
- Click here and access our complete financial health analysis report to understand the dynamics of United Arab Bank P.J.S.C.
- Gain insights into United Arab Bank P.J.S.C's historical outcomes by reviewing our past performance report.
SIM Technology Group (SEHK:2000)
Simply Wall St Financial Health Rating: ★★★★★★
Overview: SIM Technology Group Limited, with a market cap of HK$614.52 million, manufactures and sells handsets and IoT terminals across China, Hong Kong, the United States, Europe, and Asia.
Operations: The company's revenue is primarily derived from its Intelligent Terminal ODM segment, generating HK$328.94 million, followed by Property Management at HK$35.19 million.
Market Cap: HK$614.52M
SIM Technology Group Limited, with a market cap of HK$614.52 million, faces challenges as it remains unprofitable despite generating revenue primarily from its Intelligent Terminal ODM segment. The company reported a net loss of HK$11.03 million for the first half of 2026, reversing from a profit in the previous year due to decreased revenue and rising costs. However, SIM Technology maintains financial stability with short-term assets exceeding both short and long-term liabilities, alongside more cash than debt. While losses have been reduced over five years and free cash flow is growing modestly, management's inexperience may pose risks moving forward.
- Take a closer look at SIM Technology Group's potential here in our financial health report.
- Assess SIM Technology Group's previous results with our detailed historical performance reports.
Sheng Tang Holdings (SEHK:8305)
Simply Wall St Financial Health Rating: ★★★★☆☆
Overview: Sheng Tang Holdings Limited is an investment holding company that operates as a multi-disciplinary contractor in Hong Kong, with a market cap of HK$191.40 million.
Operations: The company generates revenue from two main segments: Distribution of Dairy Products, contributing HK$57.60 million, and Provision of Construction Works, accounting for HK$112.49 million.
Market Cap: HK$191.4M
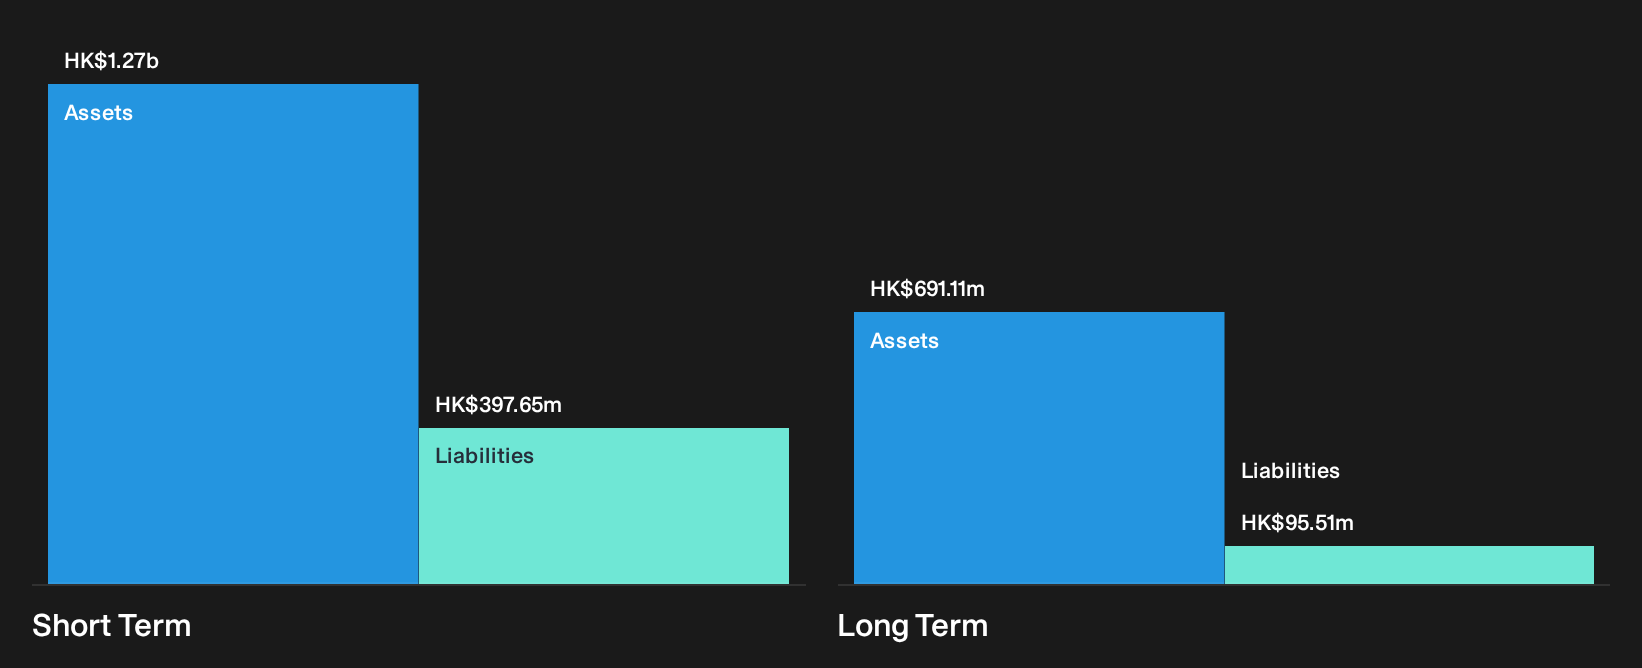
Sheng Tang Holdings Limited, with a market cap of HK$191.40 million, operates in construction and dairy distribution but remains unprofitable despite recent revenue growth. For the first half of 2026, sales increased to HK$79.68 million from HK$71.51 million year-on-year, with net income rising to HK$0.662 million from HK$0.189 million. The company's short-term assets surpass both short and long-term liabilities, indicating financial stability amidst high share price volatility and limited cash runway under a year if current free cash flow trends persist. A new board suggests potential strategic shifts as they navigate reduced debt levels over five years.
- Navigate through the intricacies of Sheng Tang Holdings with our comprehensive balance sheet health report here.
- Learn about Sheng Tang Holdings' historical performance here.

Turning Ideas Into Actions
- Get an in-depth perspective on all 3,616 Global Penny Stocks by using our screener here.
- Ready To Venture Into Other Investment Styles? Find companies with promising cash flow potential yet trading below their fair value.
This article by Simply Wall St is general in nature. We provide commentary based on historical data and analyst forecasts only using an unbiased methodology and our articles are not intended to be financial advice. It does not constitute a recommendation to buy or sell any stock, and does not take account of your objectives, or your financial situation. We aim to bring you long-term focused analysis driven by fundamental data. Note that our analysis may not factor in the latest price-sensitive company announcements or qualitative material. Simply Wall St has no position in any stocks mentioned.
Have feedback on this article? Concerned about the content? Get in touch with us directly. Alternatively, email editorial-team@simplywallst.com