
- PRICING
- LIVE QUOTES
- LEARN
- HELP


EN
Nitto Boseki (TSE:3110) Cools After A Sharp Slide On A Valuation That Still Looks Cheap
Nitto Boseki (TSE:3110) has attracted fresh attention after a recent share price move, with the stock closing at ¥2,884. Investors are now weighing this level against its earnings profile and mixed annual profit trend.
Over the shorter term, the share price has cooled, with the 30-day share price return down 8.88% and the 90-day move down 31.88%. However, Nitto Boseki still shows strong momentum in the rear-view mirror, with a 1-year total shareholder return of 92.71% and a 5-year total shareholder return of about four times the original capital.
Scan beyond Nitto Boseki and line up other potential rebound candidates with similar recent volatility by checking our hand picked 18 high quality undervalued stocks.
Bulls see Nitto Boseki’s recent slide as a reset after powerful multi year returns, while bears see it as a warning tied to softer profit trends. Which side do the current valuation clues support?
Price-to-Earnings of 11.8x for Nitto Boseki: Is it justified?
Nitto Boseki trades on a P/E of 11.8x at a share price of ¥2,884, which lines up with a stock that screens as inexpensive compared with both its own earnings profile and similar Building sector peers.
The P/E ratio compares the current share price to earnings per share and effectively shows how many years of current earnings investors are willing to pay for. For a diversified industrial group with glass fiber, medical, and insulation operations like Nitto Boseki, that yardstick helps you judge how the market is treating its profit stream next to other capital goods businesses.
This is where the gap becomes hard to ignore. The company sits on a P/E of 11.8x while the peer group average is 34.5x. That is a steep discount for a business that has recorded very strong earnings growth over the past year. Against an estimated fair P/E of 17.9x, the current multiple also comes across as well below the level the market could move toward if sentiment on its future earnings steadies.
Explore the SWS fair ratio for Nitto Boseki.
Result: Price-to-Earnings of 11.8x (UNDERVALUED)
Still, the annual net income decline of 6.87% and softer profits against a revenue base of ¥124,031m leave room for earnings disappointments that could limit any potential re rating.
Find out about the key risks to this Nitto Boseki narrative.
Another view on Nitto Boseki’s value
The P/E gap already looks wide for Nitto Boseki. A second lens makes it even starker. Our DCF model estimates the present value of future cash flows at about ¥9,710 per share, which is well above the current ¥2,884 level on this framework.
Cash flow based models can swing sharply when forecasts or discount rates shift. That can create opportunity for patient buyers but also raises the question of how much faith to place in long range assumptions when the share price has been this volatile.
Look into how the SWS DCF model arrives at its fair value.
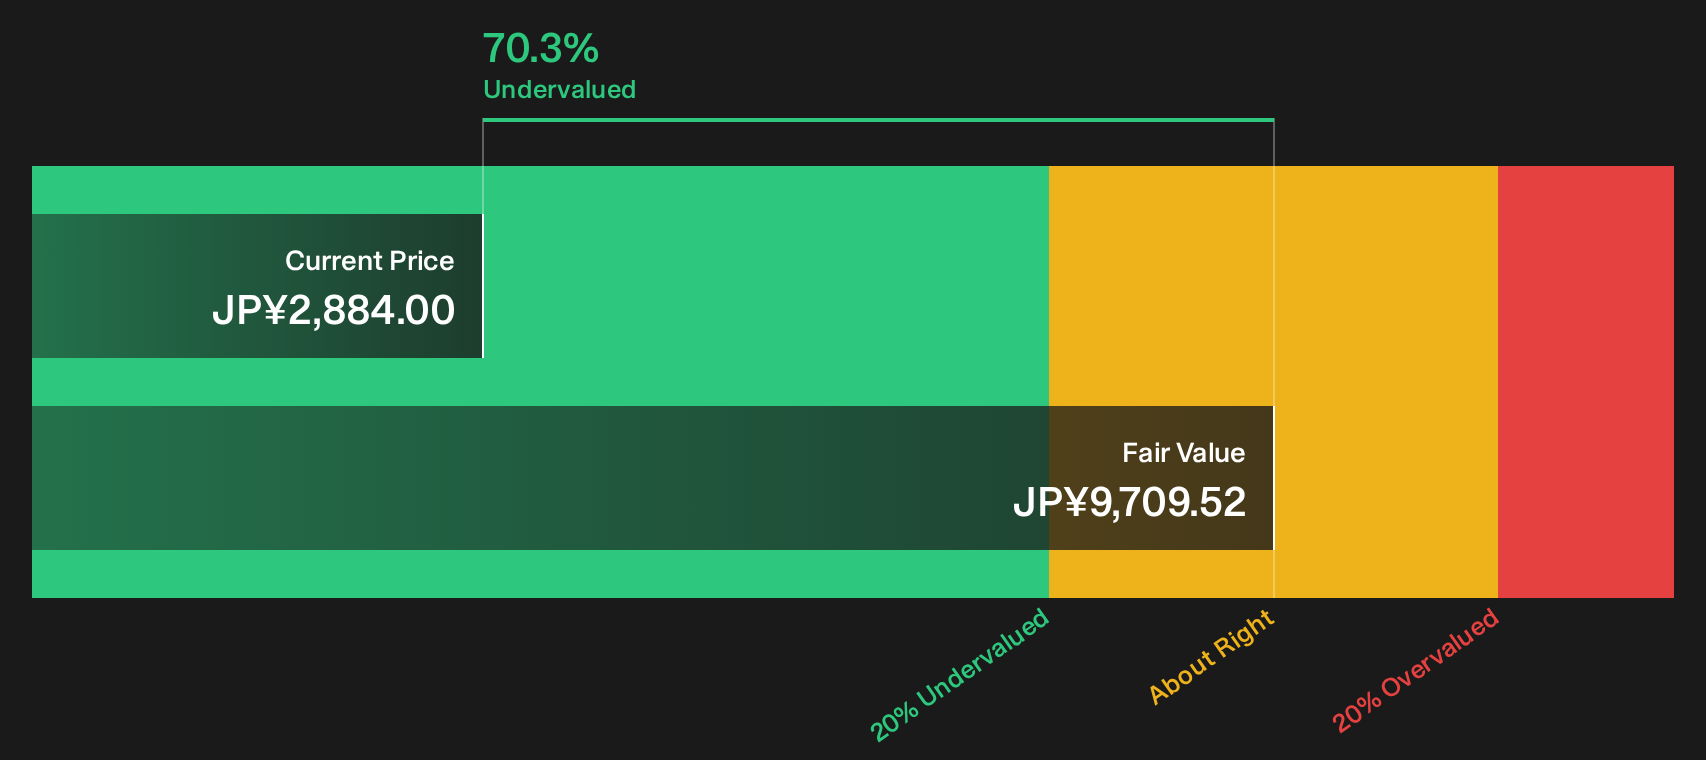
Simply Wall St performs a discounted cash flow (DCF) on every stock in the world every day (check out Nitto Boseki for example). We show the entire calculation in full. You can track the result in your watchlist or portfolio and be alerted when this changes, or use our stock screener to discover 18 high quality undervalued stocks. If you save a screener we even alert you when new companies match - so you never miss a potential opportunity.
Next Steps
Mixed signals on Nitto Boseki so far. If you want to move quickly and base your stance on the full picture of risks and upsides, start by weighing its 4 key rewards and 3 important warning signs.
Looking for more investment ideas beyond Nitto Boseki?
If Nitto Boseki has sharpened your focus on valuation and risk, do not stop here. The market will not wait while you hesitate on fresh ideas.
- Target potential mispricing by scanning companies that screen as attractively valued using the 18 high quality undervalued stocks.
- Prioritise capital protection first and look through the 12 resilient stocks with low risk scores to spot businesses with more resilient profiles.
- Hunt for under-followed opportunities by reviewing the 74 high quality undiscovered gems before other investors catch on.
This article by Simply Wall St is general in nature. We provide commentary based on historical data and analyst forecasts only using an unbiased methodology and our articles are not intended to be financial advice. It does not constitute a recommendation to buy or sell any stock, and does not take account of your objectives, or your financial situation. We aim to bring you long-term focused analysis driven by fundamental data. Note that our analysis may not factor in the latest price-sensitive company announcements or qualitative material. Simply Wall St has no position in any stocks mentioned.
Have feedback on this article? Concerned about the content? Get in touch with us directly. Alternatively, email editorial-team@simplywallst.com