
- PRICING
- LIVE QUOTES
- LEARN
- HELP


EN
Graham Holdings (GHC), What Is Behind The Latest Attention?
Graham Holdings (GHC) affirmed its regular quarterly dividend, declaring a US$1.88 per share payout scheduled for November 5, 2026, for shareholders on record as of October 15. Investors often watch such confirmations closely.
Recent trading has been mixed for Graham Holdings, with the share price down 0.7% over the past day and 2.6% over the past month. However, it has posted a 6.7% year to date share price return and a 3 year total shareholder return of about 2x, which hints that momentum has cooled in the short term after a much stronger multi year run.
Scan beyond Graham Holdings and explore other income-focused opportunities with our curated list of 6 dividend fortresses that pair yield with established cash generation.
Graham Holdings trades well above the current analyst price target, yet screens on some metrics at a steep discount to estimated fair value. Is the market rightly cautious, or mispricing this diversified group?
Price-to-Earnings of 9.1x: Is it justified?
Graham Holdings changes hands at a P/E of 9.1x, which looks inexpensive next to peers even though the stock has already outpaced the US Consumer Services sector over the past year.
The P/E ratio compares the share price with earnings per share and gives a rough sense of how much investors pay today for each dollar of profit. For a diversified group like Graham Holdings, with exposure to education, healthcare, broadcasting, manufacturing and automotive, it becomes a quick shorthand for how the market weighs that mix of cash generation, volatility and reinvestment needs.
Management has delivered earnings growth of 13.9% per year over the past 5 years, yet reported profit over the last 12 months declined 20.3% and net margins slipped from 14% to 10.7%. Large one off items and a $166.4m gain in the latest period complicate the picture, so the low P/E could reflect investors questioning how much of recent profit is repeatable versus one time.
Compared with the US Consumer Services industry average P/E of 14.4x and a broader peer average of 14.8x, the market is assigning Graham Holdings a meaningfully lower multiple despite that long term earnings record. That gap suggests investors currently price the stock at a discount to sector earnings, even though the SWS DCF model points to substantial upside, with an estimated future cash flow value of $3,239.99 against a last close of $1,159.75.
See what the numbers say about this price — find out in our valuation breakdown.
Result: Price-to-Earnings of 9.1x (UNDERVALUED)
Still, Graham Holdings relies on multiple cyclical areas, so a broad pullback in US consumer or auto activity could challenge the case for its low P/E ratio.
Find out about the key risks to this Graham Holdings narrative.
Another View on Graham Holdings Valuation
The simple P/E story for Graham Holdings looks compelling, yet the SWS DCF model paints an even starker picture. On that cash flow basis, an estimated fair value of $3,239.99 versus a last close of $1,159.75 points to a wide gap that investors need to interpret with care. Could this reflect conservative market expectations, or does it signal that the cash flow model is leaning too optimistic?
Look into how the SWS DCF model arrives at its fair value.
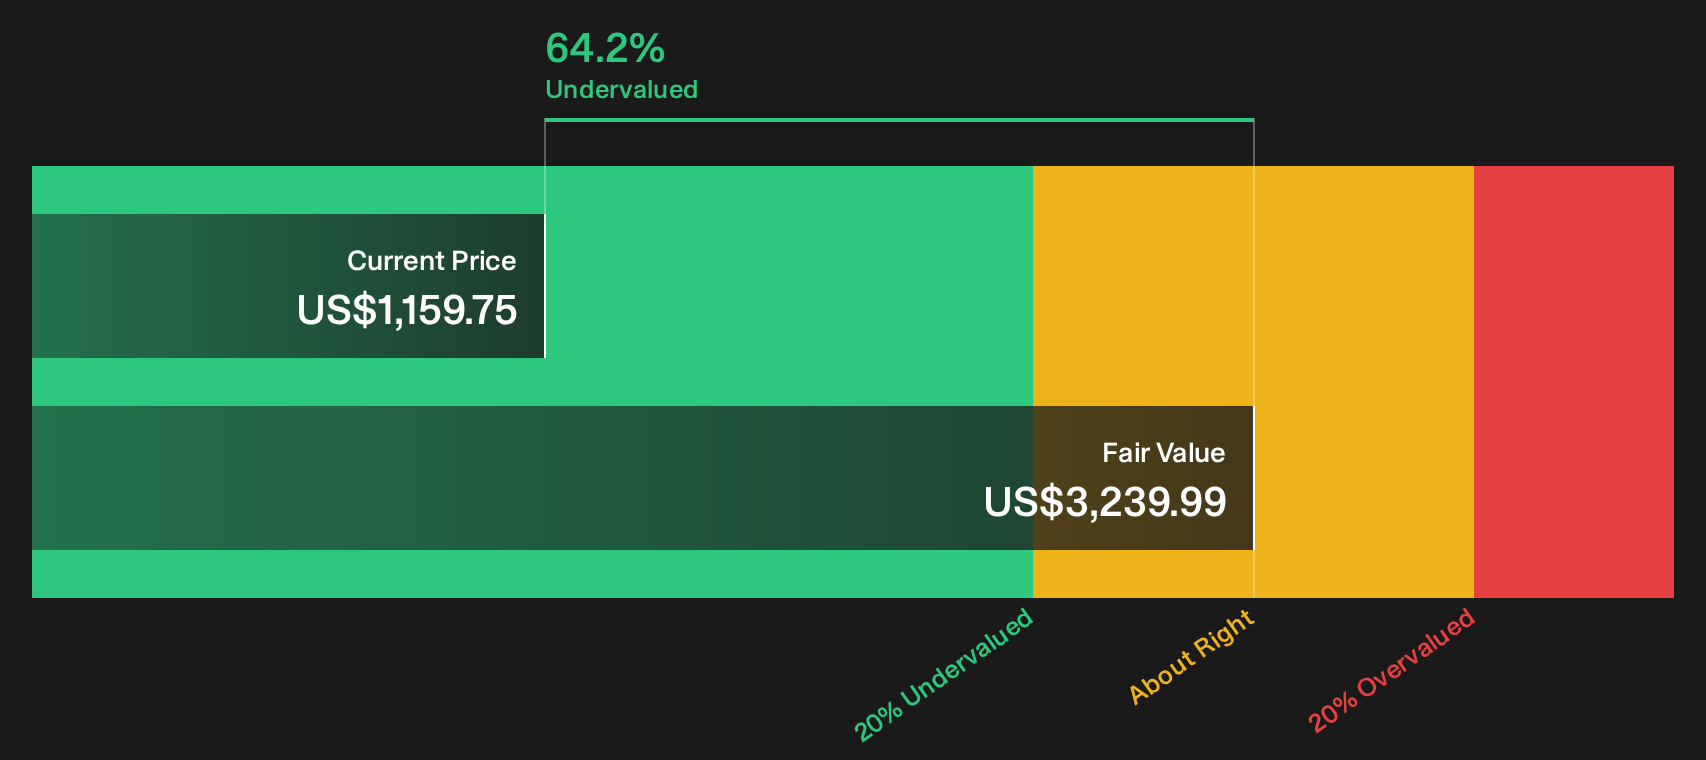
Simply Wall St performs a discounted cash flow (DCF) on every stock in the world every day (check out Graham Holdings for example). We show the entire calculation in full. You can track the result in your watchlist or portfolio and be alerted when this changes, or use our stock screener to discover 34 high quality undervalued stocks. If you save a screener we even alert you when new companies match - so you never miss a potential opportunity.
Next Steps
Mixed signals or clear opportunity? Either way, if Graham Holdings is on your radar, it makes sense to review the full picture of both risks and upside potential through the 1 key reward and 1 important warning sign.
Looking for more investment ideas beyond Graham Holdings?
Do not stop with Graham Holdings. Use the same disciplined lens on a broader watchlist so you are not relying on a single opportunity for income or returns.
- Target resilience first and stress test your portfolio with a 11 resilient stocks with low risk scores that highlights companies with more stable risk profiles.
- Hunt for quality at a discount and scan a 16 high quality undiscovered gems that focuses on underfollowed businesses with strong fundamentals.
- Strengthen your core holdings and build around a list of solid balance sheet and fundamentals (22 results) that filters for healthier finances and sturdier capital structures.
This article by Simply Wall St is general in nature. We provide commentary based on historical data and analyst forecasts only using an unbiased methodology and our articles are not intended to be financial advice. It does not constitute a recommendation to buy or sell any stock, and does not take account of your objectives, or your financial situation. We aim to bring you long-term focused analysis driven by fundamental data. Note that our analysis may not factor in the latest price-sensitive company announcements or qualitative material. Simply Wall St has no position in any stocks mentioned.
Have feedback on this article? Concerned about the content? Get in touch with us directly. Alternatively, email editorial-team@simplywallst.com