
- PRICING
- LIVE QUOTES
- LEARN
- HELP


EN
ImmuneOncia Therapeutics (KOSDAQ:424870) Is In A Good Position To Deliver On Growth Plans
Even when a business is losing money, it's possible for shareholders to make money if they buy a good business at the right price. For example, although software-as-a-service business Salesforce.com lost money for years while it grew recurring revenue, if you held shares since 2005, you'd have done very well indeed. Having said that, unprofitable companies are risky because they could potentially burn through all their cash and become distressed.
So, the natural question for ImmuneOncia Therapeutics (KOSDAQ:424870) shareholders is whether they should be concerned by its rate of cash burn. For the purpose of this article, we'll define cash burn as the amount of cash the company is spending each year to fund its growth (also called its negative free cash flow). We'll start by comparing its cash burn with its cash reserves in order to calculate its cash runway.
How Long Is ImmuneOncia Therapeutics' Cash Runway?
A cash runway is defined as the length of time it would take a company to run out of money if it kept spending at its current rate of cash burn. In June 2026, ImmuneOncia Therapeutics had ₩93b in cash, and was debt-free. In the last year, its cash burn was ₩27b. Therefore, from June 2026 it had 3.5 years of cash runway. There's no doubt that this is a reassuringly long runway. Depicted below, you can see how its cash holdings have changed over time.
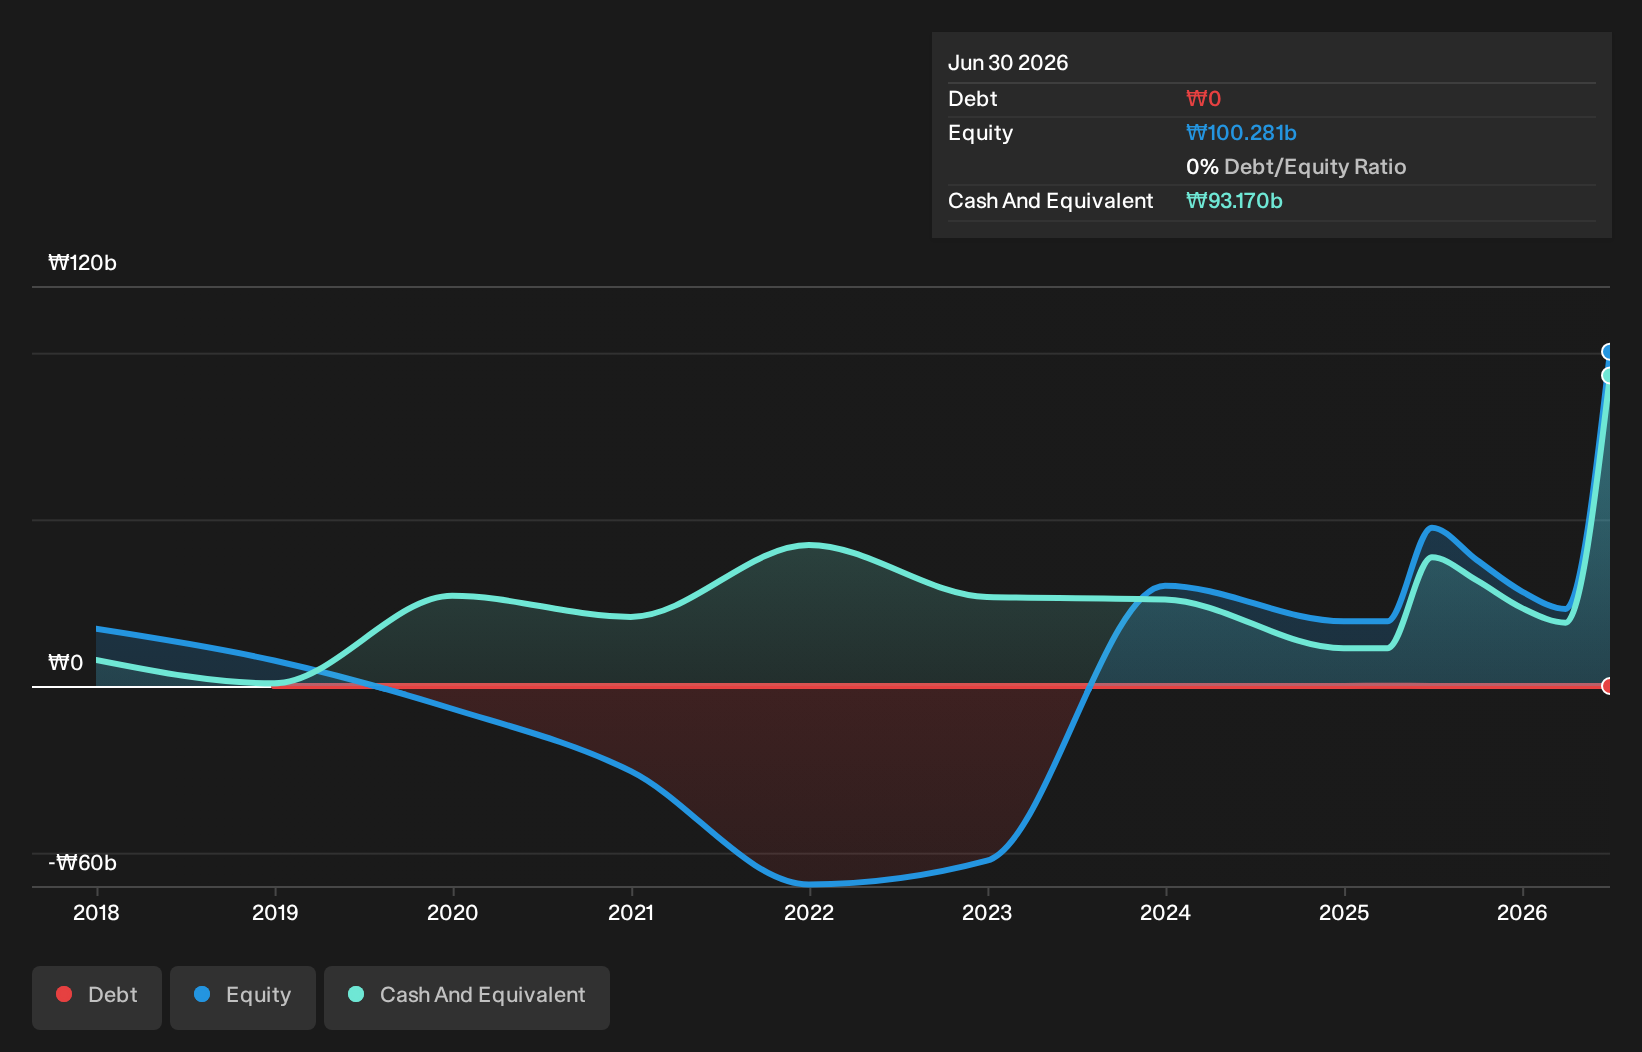
See our latest analysis for ImmuneOncia Therapeutics
How Is ImmuneOncia Therapeutics' Cash Burn Changing Over Time?
Because ImmuneOncia Therapeutics isn't currently generating revenue, we consider it an early-stage business. Nonetheless, we can still examine its cash burn trajectory as part of our assessment of its cash burn situation. Over the last year its cash burn actually increased by 46%, which suggests that management are increasing investment in future growth, but not too quickly. However, the company's true cash runway will therefore be shorter than suggested above, if spending continues to increase. ImmuneOncia Therapeutics makes us a little nervous due to its lack of substantial operating revenue. So we'd generally prefer stocks from this list of stocks that have analysts forecasting growth.
How Easily Can ImmuneOncia Therapeutics Raise Cash?
While ImmuneOncia Therapeutics does have a solid cash runway, its cash burn trajectory may have some shareholders thinking ahead to when the company may need to raise more cash. Issuing new shares, or taking on debt, are the most common ways for a listed company to raise more money for its business. Commonly, a business will sell new shares in itself to raise cash and drive growth. By looking at a company's cash burn relative to its market capitalisation, we gain insight on how much shareholders would be diluted if the company needed to raise enough cash to cover another year's cash burn.
ImmuneOncia Therapeutics' cash burn of ₩27b is about 8.4% of its ₩321b market capitalisation. That's a low proportion, so we figure the company would be able to raise more cash to fund growth, with a little dilution, or even to simply borrow some money.
How Risky Is ImmuneOncia Therapeutics' Cash Burn Situation?
It may already be apparent to you that we're relatively comfortable with the way ImmuneOncia Therapeutics is burning through its cash. In particular, we think its cash runway stands out as evidence that the company is well on top of its spending. While its increasing cash burn wasn't great, the other factors mentioned in this article more than make up for weakness on that measure. After taking into account the various metrics mentioned in this report, we're pretty comfortable with how the company is spending its cash, as it seems on track to meet its needs over the medium term. Separately, we looked at different risks affecting the company and spotted 3 warning signs for ImmuneOncia Therapeutics (of which 1 can't be ignored!) you should know about.
Of course, you might find a fantastic investment by looking elsewhere. So take a peek at this free list of companies with significant insider holdings, and this list of stocks growth stocks (according to analyst forecasts)
Have feedback on this article? Concerned about the content? Get in touch with us directly. Alternatively, email editorial-team (at) simplywallst.com.
This article by Simply Wall St is general in nature. We provide commentary based on historical data and analyst forecasts only using an unbiased methodology and our articles are not intended to be financial advice. It does not constitute a recommendation to buy or sell any stock, and does not take account of your objectives, or your financial situation. We aim to bring you long-term focused analysis driven by fundamental data. Note that our analysis may not factor in the latest price-sensitive company announcements or qualitative material. Simply Wall St has no position in any stocks mentioned.