
- PRICING
- LIVE QUOTES
- LEARN
- HELP


EN
Keppel DC REIT (SGX:AJBU) Following Its Equity Raise Looks Cheap Against Fair Value
Keppel DC REIT (SGX:AJBU) has just completed a follow on equity offering of SGD 625.002 million at SGD 2.10 per unit, shortly after confirming an advanced distribution for existing unitholders ahead of new unit issuance.
At a latest share price of SGD 2.12, Keppel DC REIT has seen its short term share price return drift lower, with the 7 day share price return down 3.2% and the 30 day share price return down 3.6%. This comes even as the 3 year total shareholder return of 14.8% and 5 year total shareholder return of 8.9% point to more constructive longer term momentum.
Scan how Keppel DC REIT compares with other income focused real estate plays by reviewing our hand picked 163 dividend fortresses, which are also built around consistent distributions.
Keppel DC REIT has raised fresh capital and seen its unit price ease back in the near term. Does that reset leave the risk reward still tilted towards buyers as valuation comes under the microscope next?
Price-to-Earnings of 11.7x: Is it justified?
Keppel DC REIT units last closed at SGD 2.12, and on an 11.7x P/E the trust screens on the lower side compared with peers even after the follow on offering.
The P/E ratio compares what investors are paying today for each dollar of earnings. This matters a lot for a specialised real estate vehicle where cash flows and distribution potential are central. For Keppel DC REIT, the combination of a 36.3% earnings increase over the past year and 11.6% per year profit growth over five years indicates that the current market multiple is relatively low compared with that profit history.
Compared with other benchmarks, the gap is clear. The 11.7x P/E sits below the peer average of 17.2x, below the global specialised REITs average of 17x, and under the estimated fair P/E of 14.6x that the SWS fair ratio model indicates could be reasonable if sentiment and fundamentals align more closely.
Explore the SWS fair ratio for Keppel DC REIT.
Result: Price-to-Earnings of 11.7x (UNDERVALUED)
Still, any squeeze on data centre demand or changes in regulation across key markets could challenge the current Keppel DC REIT valuation story.
Find out about the key risks to this Keppel DC REIT narrative.
Another View on Keppel DC REIT Valuation
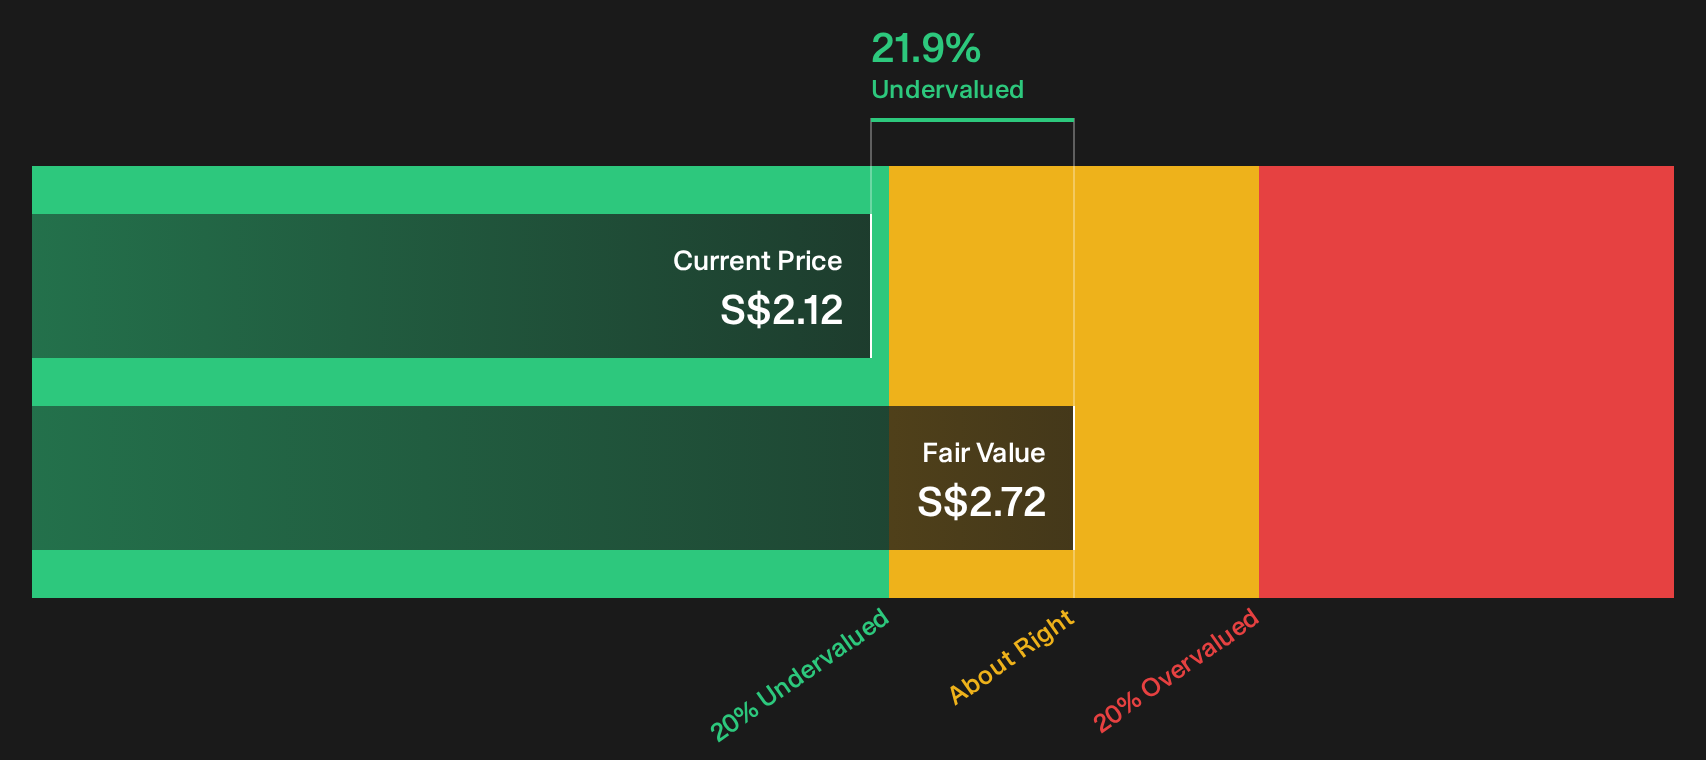
The SWS DCF model offers a different lens on Keppel DC REIT. At a unit price of SGD 2.12, the trust is assessed as trading about 21.9% below an estimated future cash flow value of SGD 2.72, which indicates potential upside if those cash flows materialise as expected.
That gap cuts both ways. It can indicate opportunity if the cash generation proves resilient, or risk if earnings trends and funding costs undercut those projections. Which side of that trade off appears more realistic to you when you consider this REIT's business profile and balance sheet strength?
Look into how the SWS DCF model arrives at its fair value.
Simply Wall St performs a discounted cash flow (DCF) on every stock in the world every day (check out Keppel DC REIT for example). We show the entire calculation in full. You can track the result in your watchlist or portfolio and be alerted when this changes, or use our stock screener to discover 193 high quality undervalued stocks. If you save a screener we even alert you when new companies match - so you never miss a potential opportunity.
Next Steps
Keppel DC REIT presents a mixed story in this piece, with both appealing metrics and clear pressure points. It may be useful to test the numbers yourself while the dust from the equity raise is still settling and then weigh the 5 key rewards and 4 important warning signs.
Looking for more investment ideas beyond Keppel DC REIT?
If Keppel DC REIT has sharpened your focus on value and income, do not stop here. You could widen your watchlist with ideas built from hard data and disciplined filters.
- Target resilient cash generators and narrow your shortlist using a list of solid balance sheet and fundamentals (196 results) that focuses on balance sheet strength and fundamental quality.
- Hunt for mispriced opportunities by scanning a 193 high quality undervalued stocks that filters for quality businesses trading below their assessed worth.
- Spot potential early stage winners by reviewing a 20 elite penny stocks with strong financials that highlights smaller companies with stronger financial profiles than the typical micro cap crowd.
This article by Simply Wall St is general in nature. We provide commentary based on historical data and analyst forecasts only using an unbiased methodology and our articles are not intended to be financial advice. It does not constitute a recommendation to buy or sell any stock, and does not take account of your objectives, or your financial situation. We aim to bring you long-term focused analysis driven by fundamental data. Note that our analysis may not factor in the latest price-sensitive company announcements or qualitative material. Simply Wall St has no position in any stocks mentioned.
Have feedback on this article? Concerned about the content? Get in touch with us directly. Alternatively, email editorial-team@simplywallst.com