
- PRICING
- LIVE QUOTES
- LEARN
- HELP


EN
Nihon Kohden (TSE:6849), Why Is Investor Attention Building Now?
Nihon Kohden (TSE:6849) drew fresh attention after its recent trading session, with the share price closing at ¥1,560.5. Investors are weighing this level against the group’s current earnings profile and regional revenue mix.
Recent trading has added some short-term momentum, with a 7 day share price return of 4.73% and a 90 day share price return of 13.12%. However, Nihon Kohden’s 1 year total shareholder return is still down 8.38%, pointing to pressure on longer term holders.
Capitalize on the renewed focus around Nihon Kohden by scanning a curated list of solid balance sheet and fundamentals (20 results) that may offer similar resilience with different return profiles.Nihon Kohden appears to be a solid medical equipment business on the surface, supported by revenue across Japan and overseas. After the recent share price move, investors may wonder whether that quality is already fully reflected in today’s valuation.
Preferred P/E Multiple of 18.3x: Is it justified?
Nihon Kohden is currently assessed as trading at a discount to an internal fair value estimate, yet the P/E ratio and cash flow valuation give slightly different angles on that story. At a last close of ¥1,560.5 and a P/E of 18.3x, the stock screens as good value against some benchmarks while still looking relatively expensive against others.
The preferred yardstick here is the P/E multiple, since Nihon Kohden generates earnings and pays a dividend. A P/E of 18.3x means investors are paying ¥18.30 for every ¥1 of recent net profit, which is one way of expressing how the market prices the company’s earnings power today. For a medical equipment group with ¥232,484 of revenue and ¥13,620 of net income, that earnings based lens is a straightforward way for shareholders to compare it against peers and against its own history.
On one hand, statements describe Nihon Kohden as good value on 18.3x relative to the peer average of 39.4x. That kind of gap suggests the market assigns a much lower earnings multiple than similar companies, even though analysts also flag high quality earnings and a reliable 2.11% dividend. On the other hand, the same 18.3x is described as expensive compared with the broader JP Medical Equipment industry on 16.7x, so the wider sector context points to a tighter margin of safety than the direct peer set alone would imply.
The fair P/E estimate adds another reference point. The stock is described as good value versus an estimated fair P/E of 19.8x, which is a level the market could move toward if sentiment and fundamentals align. Against that backdrop, the separate discounted cash flow view puts an intrinsic value of ¥1,950.58 per share from the SWS DCF model compared with the current ¥1,560.5 quote, which reinforces the idea that the present earnings multiple is not stretched when cross checked against future cash flow assumptions.
Explore the SWS fair ratio for Nihon Kohden.
Result: Price-to-earnings of 18.3x (UNDERVALUED)
Still, the narrative around Nihon Kohden could be tested if earnings growth slows from recent levels or if overseas markets deliver weaker than expected revenue contribution.
Find out about the key risks to this Nihon Kohden narrative.
Another View on Nihon Kohden’s Valuation
The P/E discussion tells one story. A different lens comes from the SWS DCF model, which estimates Nihon Kohden’s future cash flow value at ¥1,950.58 per share against the current ¥1,560.5 price. That suggests the stock may be trading below this model’s valuation. Which lens do you consider more relevant for your own process?
Look into how the SWS DCF model arrives at its fair value.
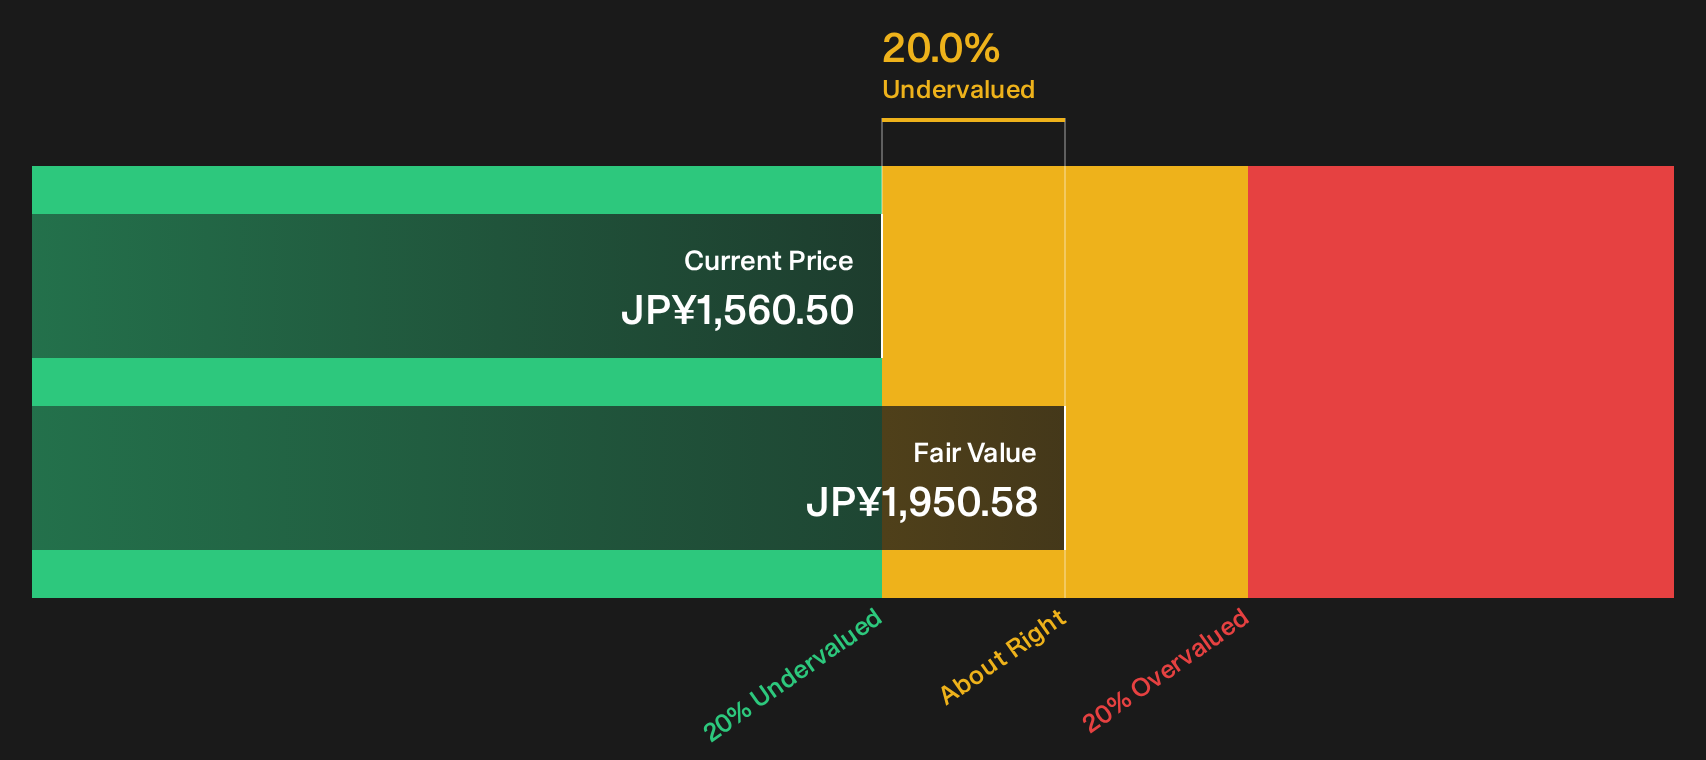
Simply Wall St performs a discounted cash flow (DCF) on every stock in the world every day (check out Nihon Kohden for example). We show the entire calculation in full. You can track the result in your watchlist or portfolio and be alerted when this changes, or use our stock screener to discover 18 high quality undervalued stocks. If you save a screener we even alert you when new companies match - so you never miss a potential opportunity.
Next Steps
Questioning whether the recent Nihon Kohden rebound really reflects the full story is healthy, and this is the moment to test that view against the numbers in detail. Move quickly, review the positives already identified, and decide if they match your own expectations by checking the 3 key rewards
Looking for more Nihon Kohden style investment ideas?
If you stop with Nihon Kohden, you might miss other opportunities that fit your approach. Use the Simply Wall St Screener to widen your field of potential ideas.
- Target steadier portfolios by scanning a curated set of 12 resilient stocks with low risk scores that may help reduce sharp swings in your overall returns.
- Hunt for mispriced quality by reviewing a focused 18 high quality undervalued stocks that highlights companies with strong fundamentals at more modest valuations.
- Build a watchlist of potential future leaders by searching a handpicked 74 high quality undiscovered gems that may sit off the usual radar yet still offer solid business profiles.
This article by Simply Wall St is general in nature. We provide commentary based on historical data and analyst forecasts only using an unbiased methodology and our articles are not intended to be financial advice. It does not constitute a recommendation to buy or sell any stock, and does not take account of your objectives, or your financial situation. We aim to bring you long-term focused analysis driven by fundamental data. Note that our analysis may not factor in the latest price-sensitive company announcements or qualitative material. Simply Wall St has no position in any stocks mentioned.
Have feedback on this article? Concerned about the content? Get in touch with us directly. Alternatively, email editorial-team@simplywallst.com