
- PRICING
- LIVE QUOTES
- LEARN
- HELP


EN
Is the Dollar Index Heading for New Lows in 2026?
I last wrote about the dollar index on Barchart on July 23, 2026, when I asked if the index that measures the U.S. currency against the world’s other leading convertible reserve currencies. I concluded the article with the following:
A weaker dollar, even if the dollar index moves higher, could fuel inflation, pushing prices of all assets higher, including commodities, stocks, cryptocurrencies, and even bonds if central banks turn on liquidity faucets during a crisis as they did in 2020. Higher asset prices may only reflect the declining purchasing power of the world’s reserve currency.
Another factor that could cause increasing volatility in the dollar index is the upcoming U.S. midterm elections. Opposition Democrats could be positioned to take control of Congress and the Senate, putting a roadblock in the way of the Trump administration’s policies. Meanwhile, fractures within the Democrats, with the rise of Democratic Socialism, could dramatically change the U.S. capitalist system. The increasing number of socialist victories in primaries could signal an eventual shift in foreign, tax, regulatory, immigration, and other policies over the coming months and years. The bottom line is that markets are in a highly uncertain period, and the dollar’s value could continue to weaken as the full faith and credit of the U.S. government deteriorates.
The dollar index is not a metric that reveals the dollar’s value, as it only reflects its value relative to other fiat currencies, making the index a mirage.
The nearby dollar index futures contract was trading at 101.31 on July 23, 2026, and was lower at under the 99.50 level on September 14, 2026. While the index’s trend has been mostly higher in 2026, the potential for a decline is rising for some compelling reasons.
The dollar index’s bullish trend in 2026
The continuous ICE dollar index futures contract closed 2025 at 98.047. After falling to a low of 95.44 on January 27, the lowest level since February 2022, the index bottomed and has made higher lows and higher highs in 2026.
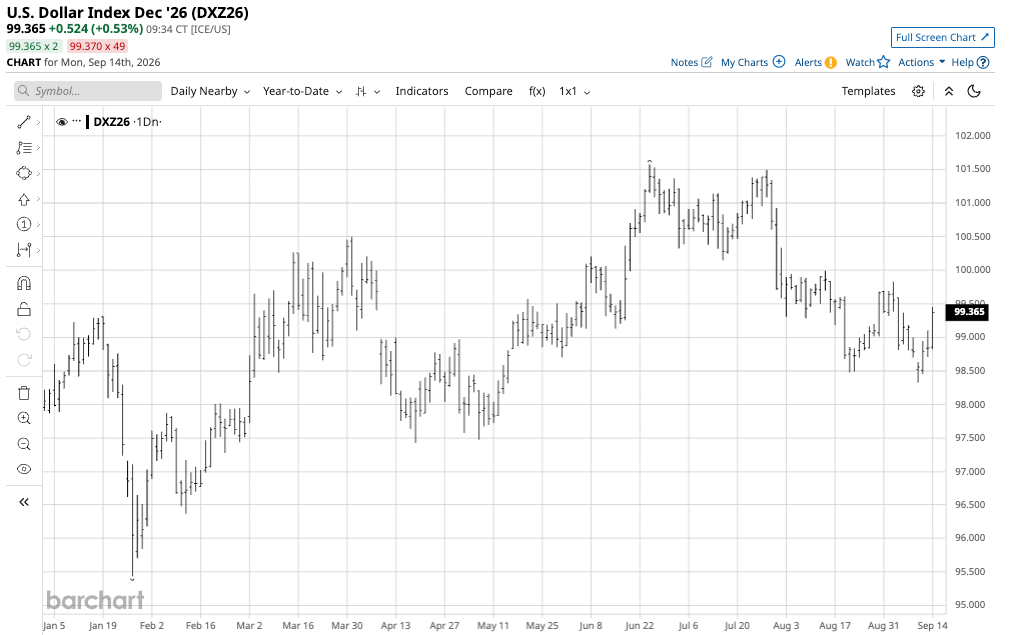
The chart shows that the dollar index futures reached a 2026 high of 101.57 on June 24. At the 99.365 level on September 14, 2026, the index is just above the midpoint between the 2026 high and low and remains in a bullish trend.
However, the index fell below its first technical support level at the low of 98.475 on August 20, when it fell to 98.325 on September 9.
A bearish trend since 2022, a bullish trend since 2008, and a bearish trend since 1985
While trends are a trader or investor’s best friend, the dollar index’s technical picture is confusing, as the short-term trend is bullish, and trends from 2022, 2008, and 1985 alternate between bearish and bullish.
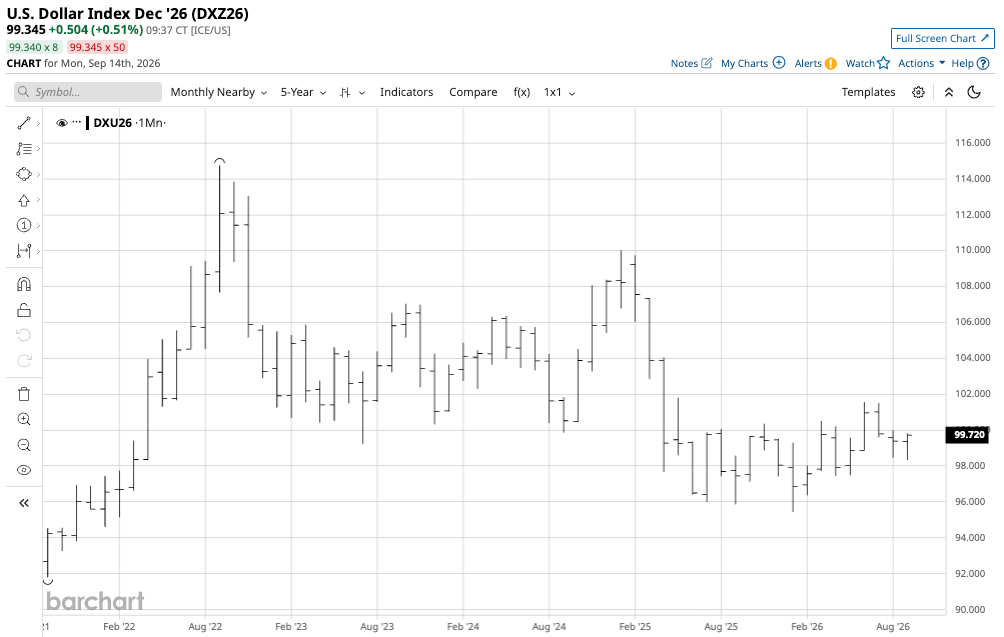
The monthly five-year chart displays the bearish trend of lower highs and lower lows since the September 2022 high of 114.745.
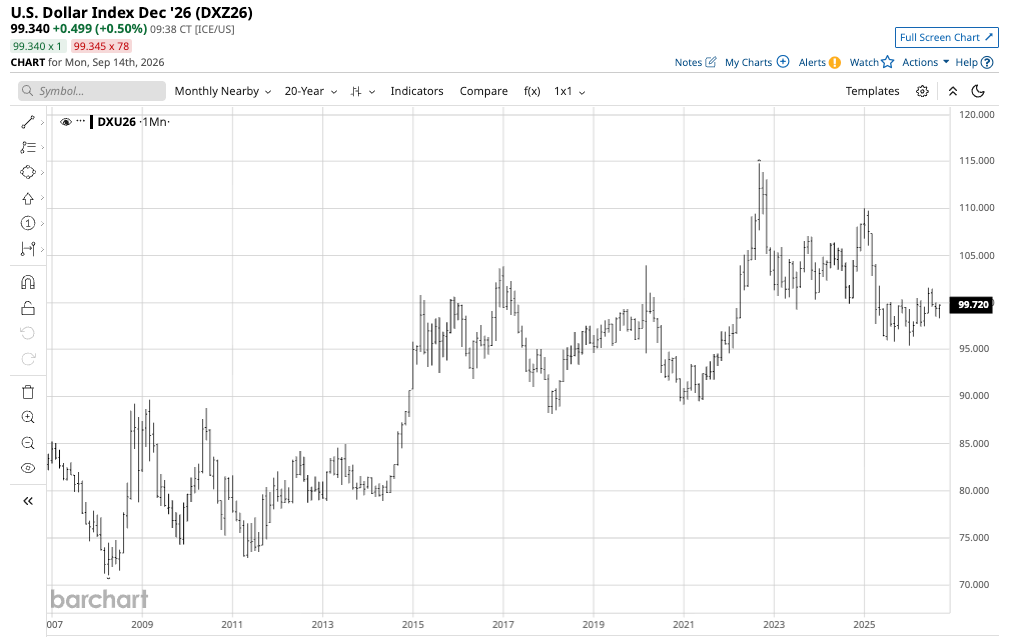
The monthly twenty-year chart shows the bullish trend of higher lows and higher highs since the April 2008 low of 71.05.
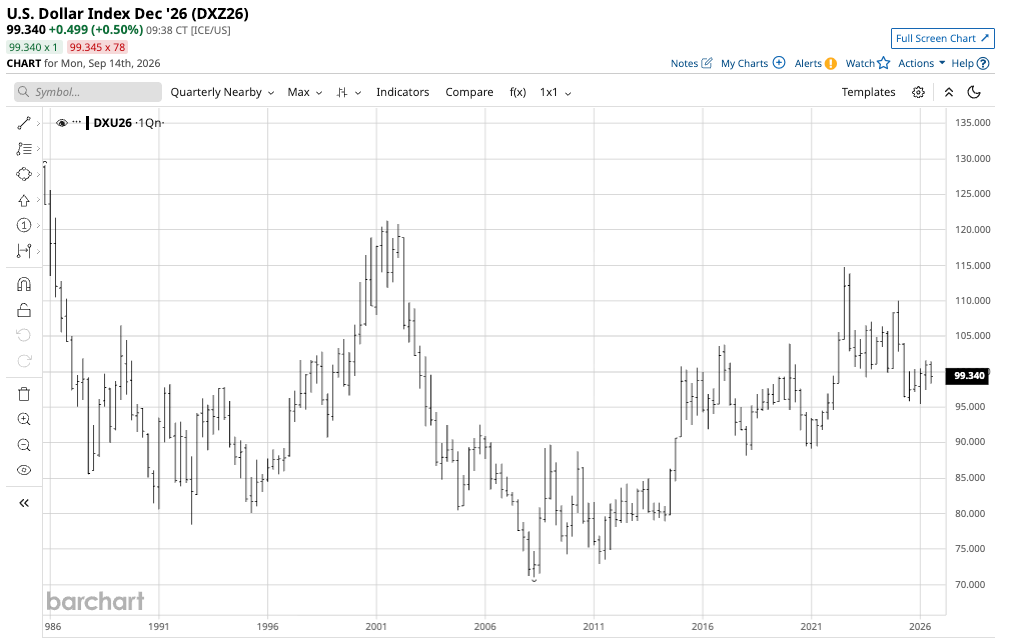
The long-term quarterly chart displays the bearish trend of lower highs and lower lows since the Q4 1985 high of 129.05.
The conflicting short-, medium-, and long-term trends in the dollar index create a confusing picture of the future path of least resistance.
The critical technical levels are 115 and 90
From a long-term perspective, critical technical support is at the January 2021 low of 89.165, which is the line in the sand for the bullish trend since 2008. Technical resistance is at the September 2022 high of 114.745, the level from which the medium-term bearish trend over the past four years developed.
Remaining within the 90-115 range will offer no concrete technical guidance or signals. At the 99.00-99.50 level in September 2026, the index is in the middle of its range, trading below its midpoint.
U.S. trade policy, war, and the midterm elections could cause lots of volatility
The factors on the horizon that could cause the dollar index to break higher or lower over the coming months and in 2027 are as follows:
- U.S. trade policy, tariffs, and sanctions could trigger a wave of de-dollarization, further deteriorating of the dollar index as the dollar depreciates against its components.
- Geopolitical tensions and the continued bifurcation of the world’s nuclear powers have economic consequences that could weigh on the dollar index.
- As inflation erodes fiat currencies’ purchasing power, the dollar and all foreign exchange instruments could continue to lose value.
- The U.S. midterm elections could shift the U.S. policy path, causing volatility in the dollar’s value against the dollar index’s components.
The dollar remains the world’s reserve currency, a role it has had for over a century. History shows that a century of dominance tends to bring change. The dollar replaced the British pound, which dominated global financial transactions from the 19th through the early 20th century. Before the pound, the Dutch guilder dominated in the 17th century, while the Spanish peseta dominated from the 16th through 17th century; and the Florentine Florin, when the European banking center was in Florence, Italy, dominated from the 13th through the 16th Century. Before the Florin, the Byzantine Gold Solidus was the primary trade currency from the 6th through the 11th century.
The historical pattern suggests that the dollar’s dominance could be waning. China’s rise could usher in an era where the yuan dominates, or central banks’ accumulation of gold could return the world to domination by the precious metal.
UUP and UDN are ETFs that track the dollar index on the upside and downside
When the dollar index finally breaks out from its 90-115 range, it could signal a significant change in the world’s reserve currency. While not on the immediate horizon, economic or geopolitical events could accelerate the dollar’s dominance or demise over the coming months and years. Any change in the dollar’s global position would impact the dollar index, which measures the U.S. currency against the euro, pound, yen, Canadian dollar, Swedish krona, and Swiss franc, with a weighting of 57.6% against the euro.
The most direct route for a risk position in the dollar index is through the futures and futures options on the Intercontinental Exchange. Futures involve leverage and specialized accounts. The Invesco DB U.S. Dollar Bullish Fund ETF (UUP) and its bearish counterpart, the Invesco DB U.S. Dollar Bearish ETF (UDN), track the dollar index on the upside and downside, respectively.
At $28.20 per share, UUP had over $422.5 million in assets under management. UUP trades an average of over 1.109 million shares per day and charges a 0.70% management fee.
At $18.21 per share, UDN had nearly $92.6 million in assets under management. UDN trades an average of more than 90,000 shares per day and charges around a 0.70% management fee.
UUP and UDN are unleveraged and liquid ETFs for market participants seeking bullish or bearish exposure to the dollar index. While the dollar index’s 2026 trend remains marginally bullish, at 99.00 to 99.50, the U.S. faces issues that could derail the positive trend over the coming weeks and months. With under four months until the end of 2026, a break below short-term technical support at 97.425 could lead to a test of the 2026 low of 95.44. The dollar index's path could significantly influence the path of least resistance for commodity prices. The U.S. dollar is the pricing mechanism for most raw materials because it is the world’s reserve currency. A falling dollar tends to support higher commodity prices, leading to rising inflation, which further erodes the dollar’s value.
On the date of publication, Andrew Hecht did not have (either directly or indirectly) positions in any of the securities mentioned in this article. All information and data in this article is solely for informational purposes. For more information please view the Barchart Disclosure Policy here.