
- PRICING
- LIVE QUOTES
- LEARN
- HELP


EN
Global Market Highlights 3 Intriguing Value Stocks Trading Below Estimated Worth
As global markets grapple with heightened geopolitical tensions and inflationary pressures, investors are navigating a complex landscape marked by fluctuating oil prices and rising Treasury yields. Amidst this volatility, identifying stocks trading below their estimated worth can present an opportunity for those looking to capitalize on potential value in the market.
Top 10 Undervalued Stocks Based On Cash Flows
| Name | Current Price | Fair Value (Est) | Discount (Est) |
| Wacom (TSE:6727) | ¥822.00 | ¥1601.48 | 48.7% |
| Thai Vegetable Oil (SET:TVO) | THB26.75 | THB51.97 | 48.5% |
| Sulzer (SWX:SUN) | CHF147.10 | CHF287.24 | 48.8% |
| P.S.P. Specialties (SET:PSP) | THB7.65 | THB14.80 | 48.3% |
| Nickel Asia (PSE:NIKL) | ₱4.45 | ₱8.61 | 48.3% |
| Dongwon Industries (KOSE:A006040) | ₩36600.00 | ₩71811.24 | 49% |
| Boliden (OM:BOL) | SEK525.60 | SEK1013.21 | 48.1% |
| Apator (WSE:APT) | PLN25.15 | PLN48.85 | 48.5% |
| AK Medical Holdings (SEHK:1789) | HK$4.91 | HK$9.60 | 48.9% |
| 3SBio (SEHK:1530) | HK$16.22 | HK$32.25 | 49.7% |
Let's explore several standout options from the results in the screener.
Astellas Pharma (TSE:4503)
Overview: Astellas Pharma Inc. is a global pharmaceutical company involved in the research, development, manufacture, sale, and supply of pharmaceuticals with a market cap of ¥4.11 trillion.
Operations: The company's revenue is primarily derived from its pharmaceutical segment, totaling ¥2.27 trillion.
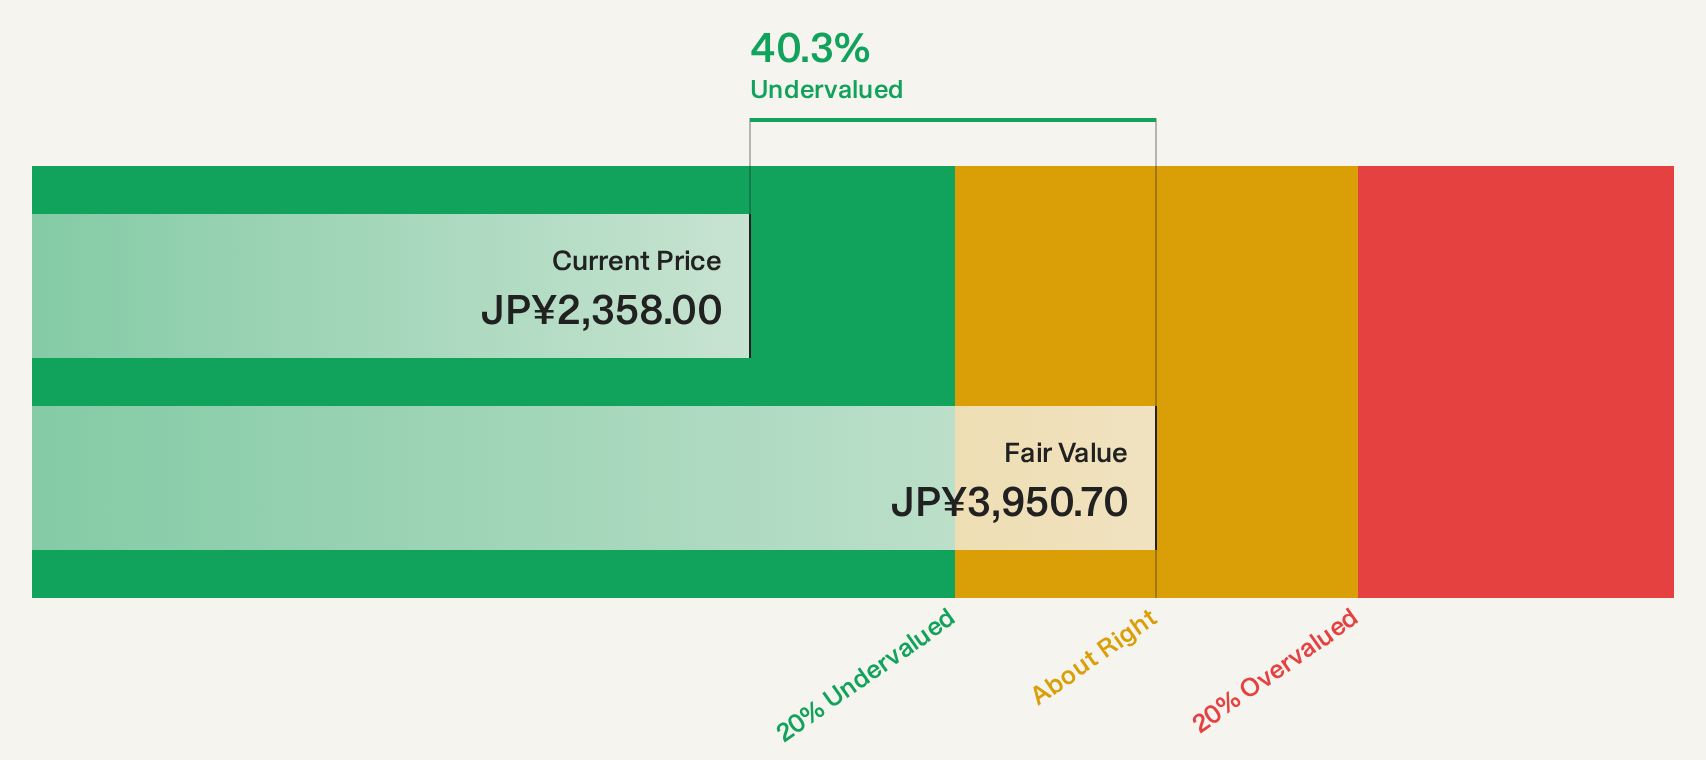
Estimated Discount To Fair Value: 41.1%
Astellas Pharma is trading at a significant discount to its estimated fair value, with shares priced ¥2,326.5 against a future cash flow valuation of ¥3,950.7. Despite this undervaluation and recent profit growth, the company's earnings and revenue are projected to decline over the next three years. Astellas maintains a reliable dividend yield of 3.44% and continues to invest in innovative treatments like ASP2138 for gastric cancer while engaging in strategic agreements to enhance patient access and affordability in healthcare markets.
- The growth report we've compiled suggests that Astellas Pharma's future prospects could be on the up.
- Click here to discover the nuances of Astellas Pharma with our detailed financial health report.
Canon (TSE:7751)
Overview: Canon Inc., along with its subsidiaries, operates in the development, production, sale, and servicing of printing, medical, imaging, and industrial equipment across Japan, the Americas, Europe, Asia, and Oceania with a market cap of approximately ¥3.78 trillion.
Operations: Canon's revenue is derived from its diverse operations in printing, medical, imaging, and industrial equipment across multiple regions including Japan, the Americas, Europe, Asia, and Oceania.
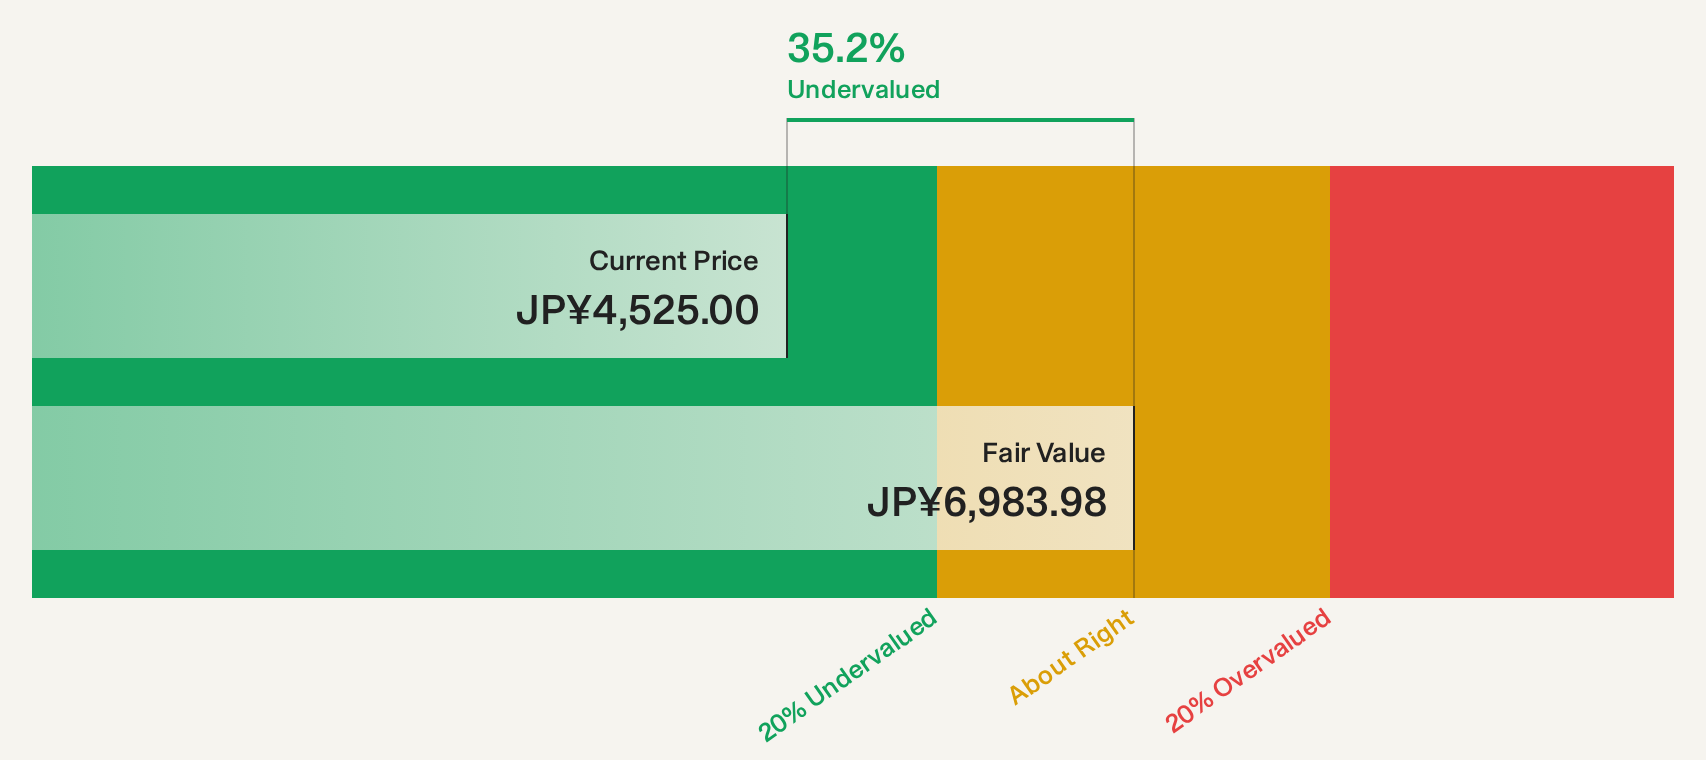
Estimated Discount To Fair Value: 36.5%
Canon is trading at a notable discount to its estimated future cash flow value, with shares priced at ¥4,431 compared to a valuation of ¥6,978.25. Despite this undervaluation and recent earnings growth of 109.1%, Canon's forecasted annual profit and revenue growth rates are below the market average in Japan. The company recently completed a significant share buyback program valued at approximately ¥200 billion, which may support shareholder value in the short term.
- Our earnings growth report unveils the potential for significant increases in Canon's future results.
- Click to explore a detailed breakdown of our findings in Canon's balance sheet health report.
Ricoh Company (TSE:7752)
Overview: Ricoh Company, Ltd. operates in digital services, digital products, graphic communications, and industrial solutions across Japan and globally with a market cap of ¥917.83 billion.
Operations: The company's revenue is derived from its operations in digital services, digital products, graphic communications, and industrial solutions across various regions including Japan, the Americas, Europe, the Middle East, and Africa.
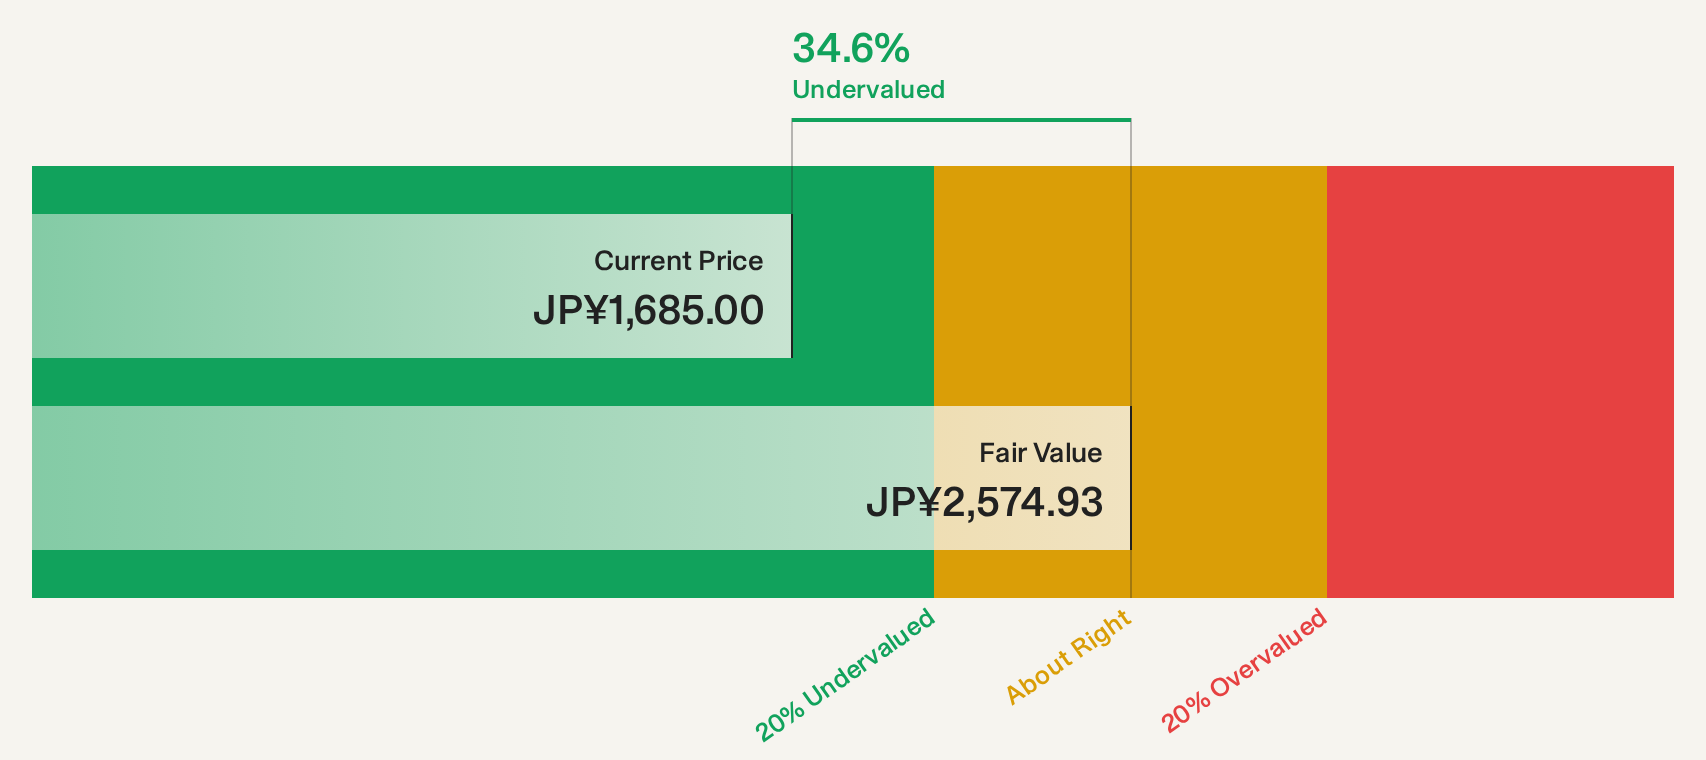
Estimated Discount To Fair Value: 36.8%
Ricoh Company is trading at ¥1,619.5, significantly below its estimated future cash flow value of ¥2,561.46, indicating it is undervalued based on cash flows. Despite this valuation gap and a 74.7% earnings growth over the past year, Ricoh's earnings are forecasted to decline by 1.8% annually over the next three years. The company has completed a share buyback worth ¥6.45 billion but faces challenges with slower revenue growth compared to the market average in Japan.
- In light of our recent growth report, it seems possible that Ricoh Company's financial performance will exceed current levels.
- Take a closer look at Ricoh Company's balance sheet health here in our report.
Make It Happen
- Click here to access our complete index of 108 Undervalued Global Stocks Based On Cash Flows.
- Got skin in the game with these stocks? Elevate how you manage them by using Simply Wall St's portfolio, where intuitive tools await to help optimize your investment outcomes.
- Simply Wall St is a revolutionary app designed for long-term stock investors, it's free and covers every market in the world.
Searching for a Fresh Perspective?
- Explore high-performing small cap companies that haven't yet garnered significant analyst attention.
- Diversify your portfolio with solid dividend payers offering reliable income streams to weather potential market turbulence.
- Fuel your portfolio with companies showing strong growth potential, backed by optimistic outlooks both from analysts and management.
This article by Simply Wall St is general in nature. We provide commentary based on historical data and analyst forecasts only using an unbiased methodology and our articles are not intended to be financial advice. It does not constitute a recommendation to buy or sell any stock, and does not take account of your objectives, or your financial situation. We aim to bring you long-term focused analysis driven by fundamental data. Note that our analysis may not factor in the latest price-sensitive company announcements or qualitative material. Simply Wall St has no position in any stocks mentioned.
Have feedback on this article? Concerned about the content? Get in touch with us directly. Alternatively, email editorial-team@simplywallst.com