
- PRICING
- LIVE QUOTES
- LEARN
- HELP


EN
What Is Driving Simcere Pharmaceutical Group (SEHK:2096) Higher Today?
Simcere Pharmaceutical Group (SEHK:2096) has hit two major milestones within days. Chinese regulators approved its Culevibart Injection for RSV prevention in newborns and infants, and Roche licensed SIM0660 with material upfront, milestone and royalty economics.
These twin announcements have come as Simcere Pharmaceutical Group’s share price has climbed 14.59% over the past 90 days, even though the 1-year total shareholder return is down 15.46% and the 3-year total shareholder return is up 84.61%. This suggests momentum has picked up again after a weaker stretch for longer term holders.
Scan beyond Simcere Pharmaceutical Group and line up other potential breakout candidates in the same kind of underfollowed territory with the 618 high quality undiscovered gems.
After a sharp 90 day rebound in Simcere Pharmaceutical Group on the back of these RSV and Roche headlines, the key decision is whether to add exposure now or wait for a more clearly defined entry point. The valuation work starts here.
Price-to-Earnings of 15.9x: Is It Justified for Simcere Pharmaceutical Group?
On the latest close at HK$11.39, Simcere Pharmaceutical Group trades on a P/E of 15.9x, which screens as inexpensive against close peers yet somewhat richer than the wider Hong Kong pharmaceuticals sector.
The P/E ratio compares what investors are paying today for each dollar of earnings. For a research driven drug developer like Simcere Pharmaceutical Group, this metric often reflects how much the market is willing to pay for its current profit base while factoring in expectations for future treatments and product launches.
Compared with similar companies, the stock trades at 15.9x earnings versus a peer average of 30.3x. That is a sizeable discount and suggests the market is assigning a lower price for each unit of profit than it does for comparable pharmaceutical businesses. In that context, the fair P/E estimate of 20.2x points to a level the multiple could logically migrate toward if current earnings quality and growth expectations hold, since it implies investors might be underpaying relative to that reference point.
Against the broader Hong Kong pharmaceuticals industry, which sits at 14.2x, Simcere Pharmaceutical Group changes hands at a modest premium. That hints that investors are pricing the shares above the sector average while still well below both the peer group and the estimated fair multiple.
Explore the SWS fair ratio for Simcere Pharmaceutical Group.
Result: Price-to-Earnings of 15.9x (UNDERVALUED)
Still, Simcere Pharmaceutical Group faces real pressure if clinical assets slip in trials or if pricing and reimbursement for its newly approved products come in softer than investors expect.
Find out about the key risks to this Simcere Pharmaceutical Group narrative.
Another View on Simcere Pharmaceutical Group: DCF Says HK$14.70
The P/E work suggests Simcere Pharmaceutical Group is on the cheap side, yet the SWS DCF model goes further. On that framework, the shares at HK$11.39 sit below an estimated future cash flow value of HK$14.70, which is flagged as undervalued.
That gap gives you a very different lens on the same stock. Look into how the SWS DCF model arrives at its fair value.
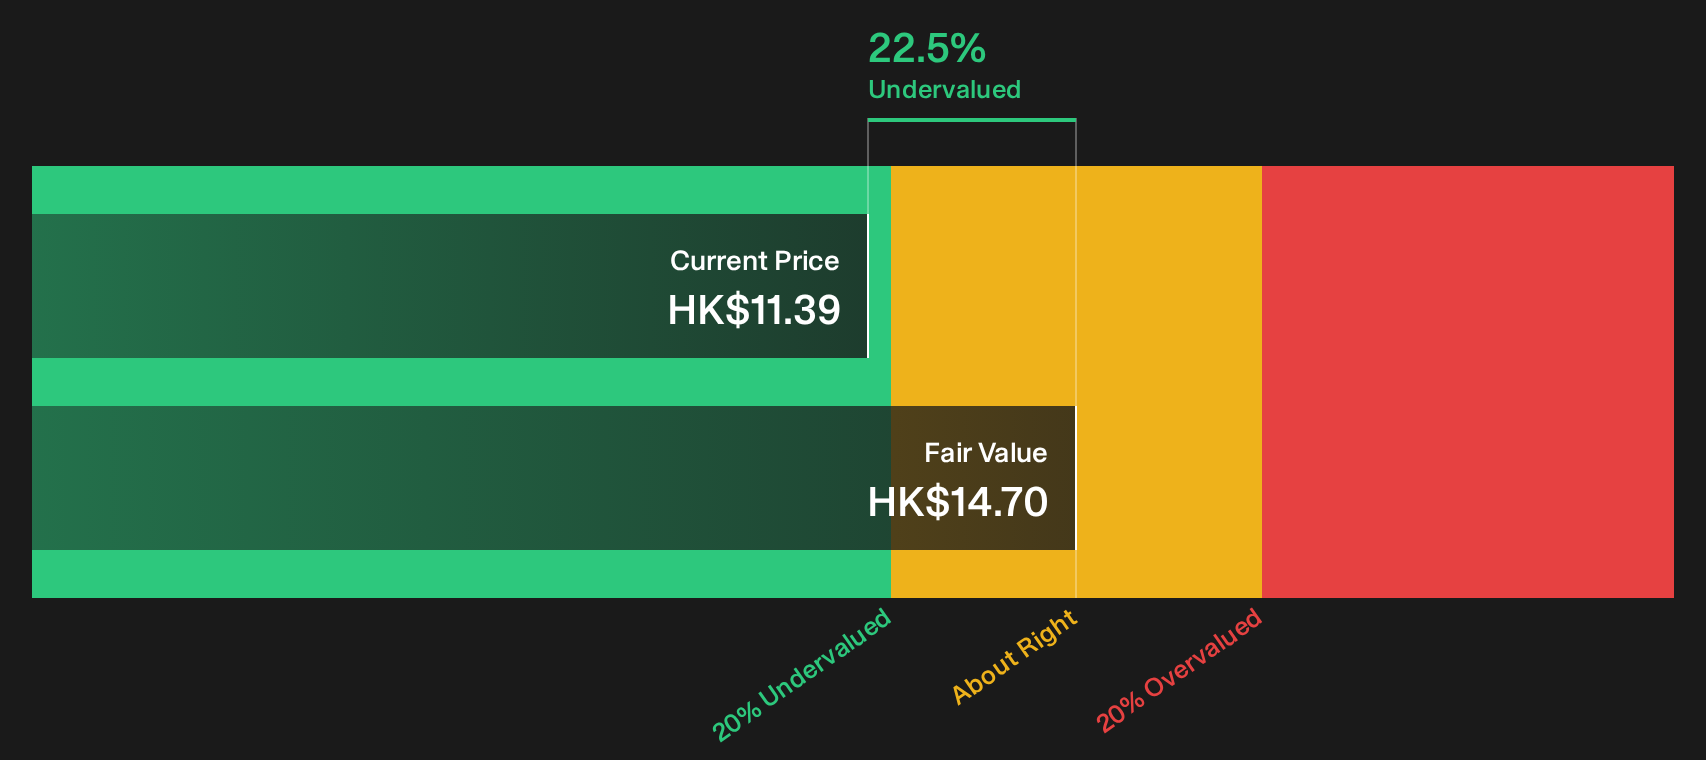
Simply Wall St performs a discounted cash flow (DCF) on every stock in the world every day (check out Simcere Pharmaceutical Group for example). We show the entire calculation in full. You can track the result in your watchlist or portfolio and be alerted when this changes, or use our stock screener to discover 192 high quality undervalued stocks. If you save a screener we even alert you when new companies match - so you never miss a potential opportunity.
Next Steps
Mixed signals on Simcere Pharmaceutical Group so far. If you want to move quickly and reach your own verdict, take a closer look at the 3 key rewards and 1 important warning sign.
Looking for more investment ideas beyond Simcere Pharmaceutical Group?
If Simcere Pharmaceutical Group has sharpened your focus on valuation, do not stop here. Fresh opportunities often appear first in the data, not the headlines.
- Spot potential value plays early and compare them side by side using the 192 high quality undervalued stocks.
- Prioritise resilience by filtering for companies with sturdy finances through the list of solid balance sheet and fundamentals (194 results).
- Target consistency and defence in your portfolio by scanning for income candidates in the 162 dividend fortresses.
This article by Simply Wall St is general in nature. We provide commentary based on historical data and analyst forecasts only using an unbiased methodology and our articles are not intended to be financial advice. It does not constitute a recommendation to buy or sell any stock, and does not take account of your objectives, or your financial situation. We aim to bring you long-term focused analysis driven by fundamental data. Note that our analysis may not factor in the latest price-sensitive company announcements or qualitative material. Simply Wall St has no position in any stocks mentioned.
Have feedback on this article? Concerned about the content? Get in touch with us directly. Alternatively, email editorial-team@simplywallst.com