
- PRICING
- LIVE QUOTES
- LEARN
- HELP


EN
Is Winmark (WINA) Still Expensive Following Its Sharp Share Price Pullback?
Winmark (WINA) has drawn fresh attention after a sustained share price pullback, with the stock down 15% over the past month and 26% in the past 3 months, which has sharpened focus on its resale-franchising model.
Over a longer window, the picture is mixed. The recent slide leaves Winmark with a year to date share price return down 25.43%, while the 1 year total shareholder return has fallen 37.86% and the 5 year total shareholder return remains up 65.03%. This points to momentum that has cooled after a strong multi year run.
Look beyond Winmark's recent pullback and consider other potential turnaround candidates in our hand picked list of 35 high quality undervalued stocks with solid fundamentals.
After a long stretch of gains and a sharp reset, Winmark now sits in a very different spot on the chart. Has most of the upside already played out, or does this reset change the value story ahead?
Preferred P/E of 26.4x for Winmark: Is it justified?
Valuation now sits at the center of the Winmark conversation because the stock trades on a P/E of 26.4x while recent share performance has been weak. That mix of a premium earnings multiple and falling price puts the focus on whether the current tag still lines up with what the business is delivering.
The P/E ratio compares the share price with earnings per share. For a franchisor like Winmark that generates high net margins and relies heavily on fee income rather than heavy inventory or store capex, investors often watch the earnings multiple closely as a shorthand for what the market is willing to pay for that cash generation.
On the numbers provided, Winmark is described as expensive on several fronts. The P/E of 26.4x is higher than the estimated fair P/E of 11.7x, higher than the US Specialty Retail industry average of 16.6x and also above the peer average of 17.5x. That combination suggests the valuation has been rich compared with both a fair value regression level that the market could move toward and with sector and peer benchmarks.
In short, the P/E premium over industry, peers and the fair ratio signals that the stock is being priced above those reference points.
Explore the SWS fair ratio for Winmark.
Result: Price-to-earnings of 26.4x (OVERVALUED)
Still, the recent share price slide and a P/E well above industry benchmarks leave Winmark exposed if franchise demand softens or leasing activity disappoints.
Find out about the key risks to this Winmark narrative.
Another View on Winmark's Value
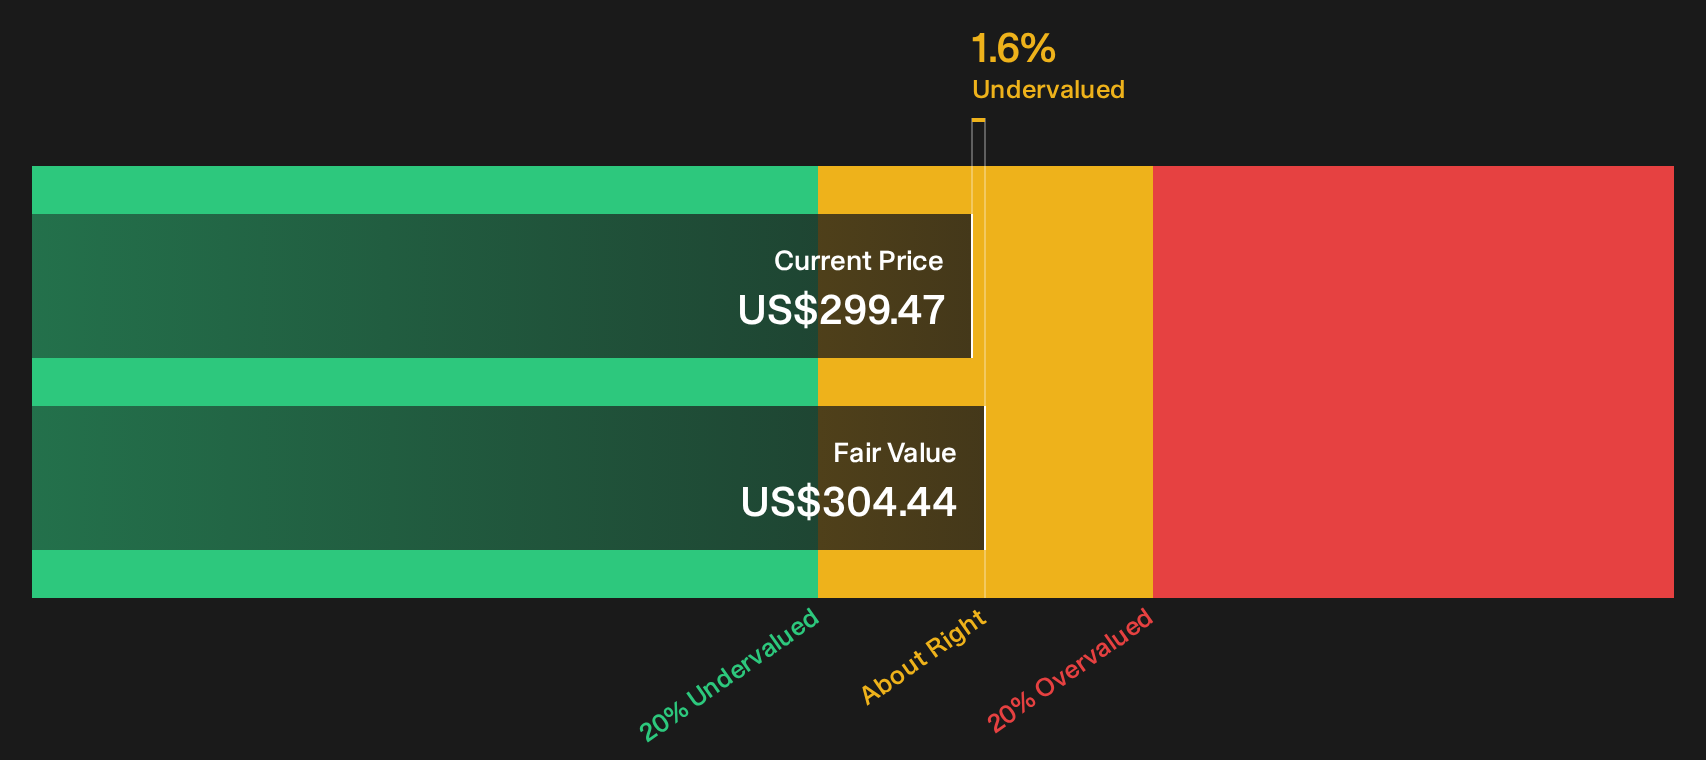
A different lens tells a softer story. Our DCF model suggests Winmark at $299.47 trades only 1.6% below an estimated future cash flow value of $304.44, which points to shares being roughly in line with intrinsic value rather than dramatically mispriced.
This kind of small gap often leaves investors asking whether the bigger issue is expectations baked into that rich 26.4x P/E, or the assumptions sitting inside the cash flow model itself. If both are roughly right, the scope for a big valuation swing either way may be tighter than the recent share price volatility implies.
Look into how the SWS DCF model arrives at its fair value.
Simply Wall St performs a discounted cash flow (DCF) on every stock in the world every day (check out Winmark for example). We show the entire calculation in full. You can track the result in your watchlist or portfolio and be alerted when this changes, or use our stock screener to discover 35 high quality undervalued stocks. If you save a screener we even alert you when new companies match - so you never miss a potential opportunity.
Next Steps
Mixed signals on Winmark so far. If you want to move quickly and rely on the full picture of both concerns and potential upsides, review the 2 key rewards and 3 important warning signs
Looking for more investment ideas beyond Winmark?
Do not stop with Winmark. Use the Simply Wall St screener to quickly surface fresh opportunities that fit your style before others focus on them.
- Target reliable income streams by reviewing companies in our list of 6 dividend fortresses tailored for investors who care about yield and resilience.
- Hunt for quality at a discount by scanning the 15 high quality undiscovered gems that combine solid fundamentals with limited market attention.
- Prioritise capital preservation by focusing on the 11 resilient stocks with low risk scores that score well on financial strength and volatility.
This article by Simply Wall St is general in nature. We provide commentary based on historical data and analyst forecasts only using an unbiased methodology and our articles are not intended to be financial advice. It does not constitute a recommendation to buy or sell any stock, and does not take account of your objectives, or your financial situation. We aim to bring you long-term focused analysis driven by fundamental data. Note that our analysis may not factor in the latest price-sensitive company announcements or qualitative material. Simply Wall St has no position in any stocks mentioned.
Have feedback on this article? Concerned about the content? Get in touch with us directly. Alternatively, email editorial-team@simplywallst.com