
- PRICING
- LIVE QUOTES
- LEARN
- HELP


EN
Graham (GHM) Stock Trades Above Fair Value On Earnings
Graham has delivered a very strong multiyear share price run, so the obvious question now is whether the current valuation can still be explained by its earnings power. With the stock pulling back in recent weeks after a long climb, investors are asking if the recent price puts too much, or too little, weight on what the business earns.
- Over the past 5 years Graham has produced a very large total return, which raises the question of how much of that move is supported by the underlying earnings profile.
- The company’s value hinges on how efficiently it can convert its industrial projects into sustainable profits and cash flow, because that earnings base is what ultimately needs to support today’s share price.
- Your read on Graham is one view; the desks covering it have another. See what analysts think Graham's shares could be worth.
The stock’s next move may depend on whether Graham’s current price can be explained by its earnings when set against the Fair Ratio benchmark.
If you are weighing whether Graham’s recent 615.6% five year return matches its earnings profile, it can help to compare with a focused list of 35 high quality undervalued stocks.
Is Graham Getting Expensive on Earnings?
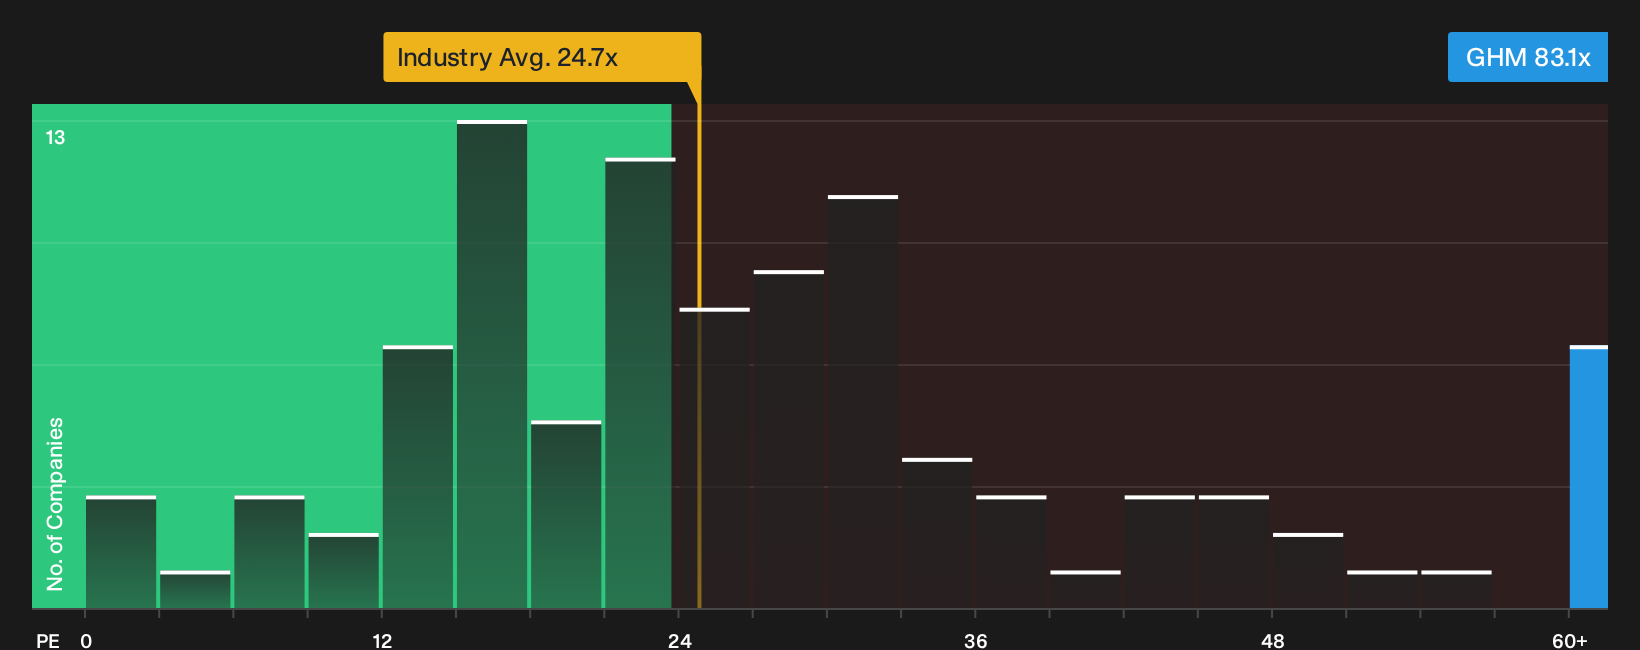
The P/E ratio works well for Graham because earnings are a key reference point for how investors value an industrial contractor with project driven work. Graham trades on a P/E of 83.1x, which is well above the Machinery sector average of 24.7x, and also higher than the peer group at 37.3x. That is a rich headline multiple for this kind of business and suggests the market is placing a strong premium on its profit stream.
A Fair Ratio framework, which looks at metrics such as growth profile, margins, risk and size rather than just simple sector medians, points to a lower earnings multiple than where the stock changes hands today. On this measure Graham comes across as overvalued relative to the earnings level that model would pair with the business, so any new buyer needs to judge whether the qualitative story and future delivery can justify paying up for that kind of earnings tag. Explore the numbers behind Graham's P/E valuation.
The Graham Narrative: What Would Justify Today's Price?
Simply Wall St Narratives for Graham pick up where the valuation puzzle leaves off, by laying out the specific growth, margin and earnings paths that would need to hold for the stock to be worth materially more or materially less than today’s price. They sit on the company’s Community page so you can see the assumptions behind any single ratio or model and track over time whether the real world is matching that script.
One of the top community narratives on Graham: 33% undervalued
"Record backlog growth and strong book-to-bill ratio signal rising multi-year demand, underpinned by sustained U.S. Navy defense programs and increasing global infrastructure investment..."
Discover why this Narrative puts Graham at 33% undervalued.
Before acting on Graham’s valuation, there is one more angle to check
Price ratios and profit history only tell part of the story, because the outcome for shareholders also depends on who is steering Graham and how their incentives are structured. See who runs Graham and how they are paid.
This article by Simply Wall St is general in nature. We provide commentary based on historical data and analyst forecasts only using an unbiased methodology and our articles are not intended to be financial advice. It does not constitute a recommendation to buy or sell any stock, and does not take account of your objectives, or your financial situation. We aim to bring you long-term focused analysis driven by fundamental data. Note that our analysis may not factor in the latest price-sensitive company announcements or qualitative material. Simply Wall St has no position in any stocks mentioned.
Have feedback on this article? Concerned about the content? Get in touch with us directly. Alternatively, email editorial-team@simplywallst.com