
- PRICING
- LIVE QUOTES
- LEARN
- HELP


EN
Visional (TSE:4194) Posts Strong Full Year Growth, Is The Valuation Still Reasonable?
Visional (TSE:4194) just paired fresh full year 2026 results with new guidance for the year to July 2027, giving investors updated visibility on sales, profits and earnings per share.
Visional's latest earnings and fresh guidance arrived alongside a sharp 4.5% one-day share price gain to ¥8,389. However, the stock is still down 10.3% on a 30-day share price basis and carries a 27.9% decline in 1-year total shareholder return, while a 3-year total shareholder return of 8.9% suggests that long-term sentiment has been more resilient than recent trading implies.
Capitalize on Visional’s fresh guidance and earnings momentum by lining it up against hand-picked peers screened for 17 high quality undervalued stocks in similar quality brackets.Visional just backed solid recent results and fresh 2027 guidance with a sharp one day rebound in the share price. The bigger question now is whether that quality is still selling at a reasonable tag.
Price-to-Earnings of 18.3x: Is it justified for Visional?
On the latest figures, Visional trades on a P/E of 18.3x, which sits above both its Professional Services peer group on 16.1x and the broader industry on 13.3x, even though Simply Wall St estimates the shares are trading 52.9% below fair value based on its own modelling.
The P/E ratio compares the share price to earnings per share and gives a quick shorthand for how much investors are paying for each unit of profit. For a human resources platform group like Visional that reports high quality earnings and a current return on equity of 21.6%, a richer than average multiple often reflects expectations that profits can keep compounding from this base.
Against the industry, the stock trades at a clearly higher earnings multiple. This suggests the market is pricing Visional's track record and forecasts more optimistically than many Professional Services peers. Yet the estimated fair P/E of 21x indicates the current 18.3x level sits below where Simply Wall St's fair ratio work suggests the valuation could trend if those assumptions play out.
Explore the SWS fair ratio for Visional.
Result: Price-to-Earnings of 18.3x (OVERVALUED compared to peers, BELOW fair ratio)
Still, Visional's premium P/E and concentrated revenue in Japan leave the story exposed if domestic HR spending cools or if execution in the smaller Incubation segment stumbles.
Find out about the key risks to this Visional narrative.
Another view on Visional’s value
The P/E discussion frames Visional as expensive against peers, yet Simply Wall St’s DCF work points in the opposite direction. At ¥8,389 the stock is described as trading below an estimated future cash flow value of ¥17,824.45, which implies the cash generation story presents a much cheaper picture.
For investors, that difference between earnings multiples and our DCF model raises a simple question: which lens will guide where the share price spends more time over the next few years?
Look into how the SWS DCF model arrives at its fair value.
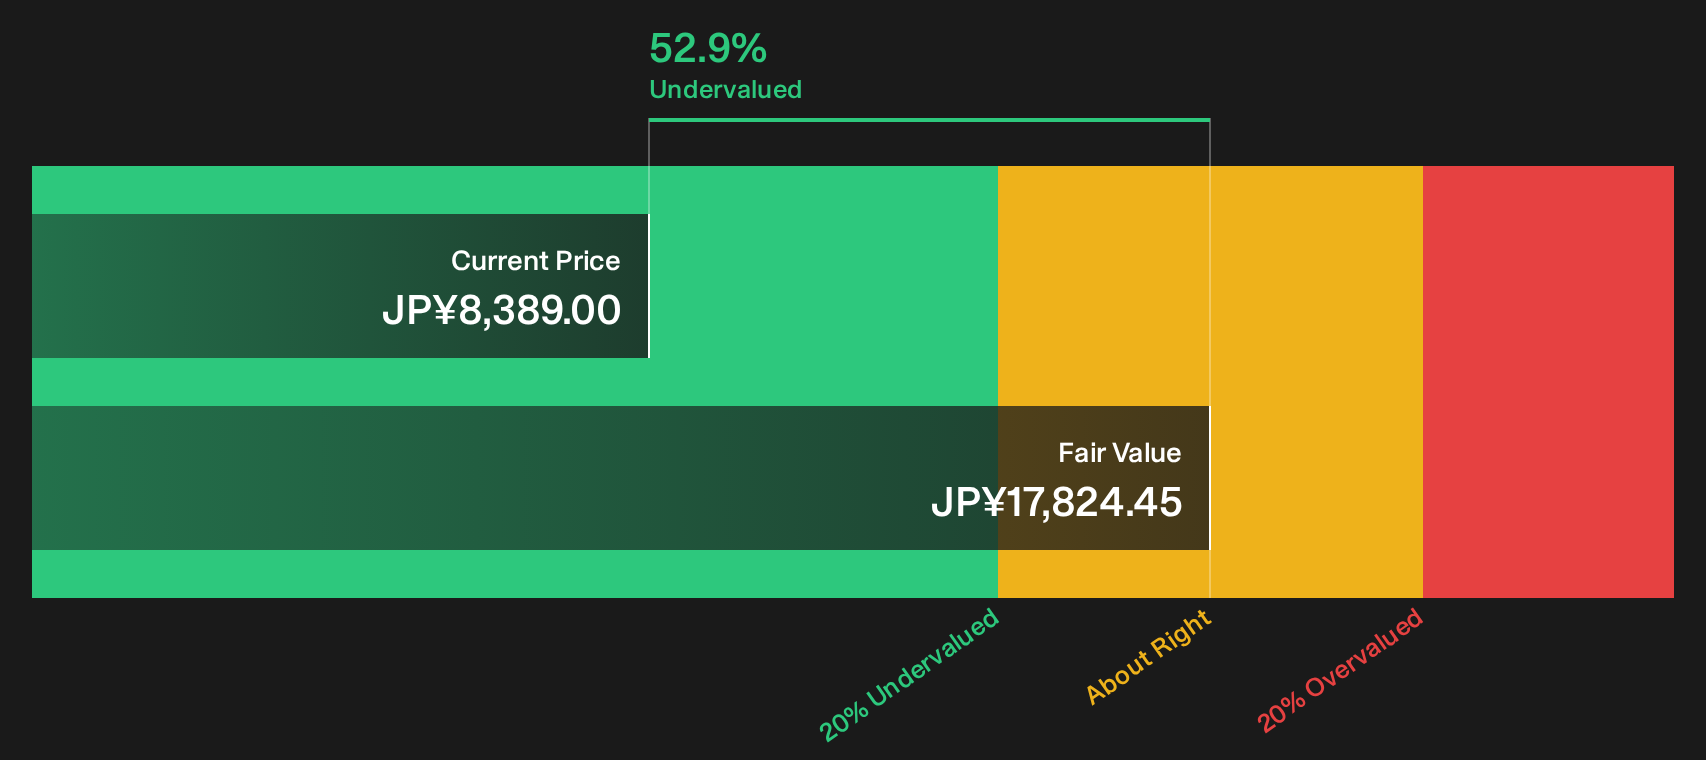
Simply Wall St performs a discounted cash flow (DCF) on every stock in the world every day (check out Visional for example). We show the entire calculation in full. You can track the result in your watchlist or portfolio and be alerted when this changes, or use our stock screener to discover 17 high quality undervalued stocks. If you save a screener we even alert you when new companies match - so you never miss a potential opportunity.
Next Steps
Mixed signals around Visional’s valuation and outlook are clear, so use that tension as a prompt to check the numbers yourself and decide where you stand. To weigh those trade offs directly, start with the 4 key rewards and 1 important warning sign.
Looking for more Visional investment ideas?
If Visional has your attention, use that momentum to widen your watchlist and pressure test your thesis against other opportunities on the Simply Wall St Screener.
- Hunt for mispriced quality by reviewing companies flagged in the 17 high quality undervalued stocks that pair strong fundamentals with more modest valuations.
- Strengthen your income stream by scanning for resilient payers inside the 18 dividend fortresses that focus on meaningful yields with support from underlying cash flows.
- Sleep easier through volatility by checking out businesses in the 12 resilient stocks with low risk scores that score well on resilience and financial robustness.
This article by Simply Wall St is general in nature. We provide commentary based on historical data and analyst forecasts only using an unbiased methodology and our articles are not intended to be financial advice. It does not constitute a recommendation to buy or sell any stock, and does not take account of your objectives, or your financial situation. We aim to bring you long-term focused analysis driven by fundamental data. Note that our analysis may not factor in the latest price-sensitive company announcements or qualitative material. Simply Wall St has no position in any stocks mentioned.
Have feedback on this article? Concerned about the content? Get in touch with us directly. Alternatively, email editorial-team@simplywallst.com