
- PRICING
- LIVE QUOTES
- LEARN
- HELP


EN
Kobe Bussan Stock Sales Rise While Earnings Slip In Nine Month Results
- Kobe Bussan reported nine month earnings to July 31, 2026, with sales of ¥432,933 million and net income of ¥23,354 million, alongside basic EPS from continuing operations of ¥105.3.
- The mix of higher sales and lower earnings per share points to profit pressure, likely tied to costs or pricing. This directly affects how resilient Kobe Bussan’s business model looks.
- We will now explore how Kobe Bussan’s investment narrative is affected by rising sales but softer earnings per share in this latest update.
Scan how Kobe Bussan’s earnings squeeze compares with other consumer-focused businesses under pressure by reviewing our hand picked list of 17 high quality undervalued stocks.
What Is Kobe Bussan's Investment Narrative?
The big picture for Kobe Bussan is simple. You need to believe the Gyomu Super format can keep pulling shoppers in while the group manages cost pressure that is now clearly visible in the latest nine month results. Sales reached ¥432,933 million, net income was ¥23,354 million and basic EPS from continuing operations came in at ¥105.3. That mix matters because near term share price drivers often sit in margin trends rather than headline growth.
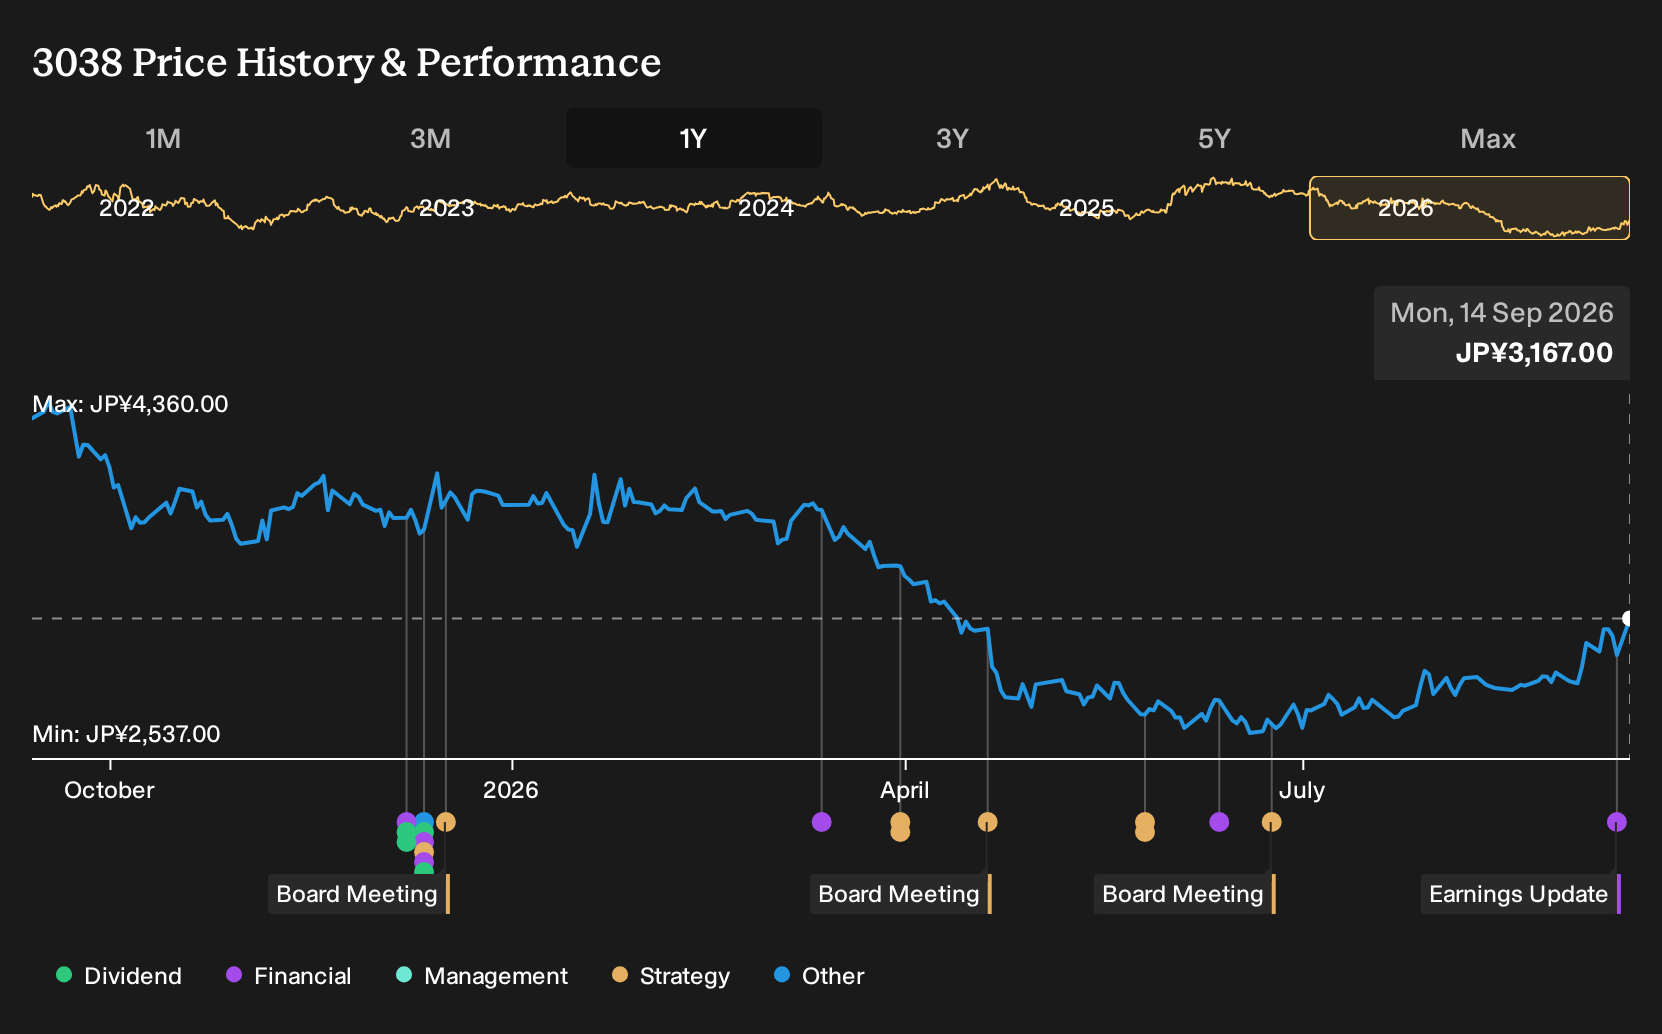
Recent returns show a rebound over 90 days, even though the 1 year performance is still lower, so the market already feels more constructive about the story. The September earnings update, with softer earnings per share, puts more weight on execution around sourcing, pricing and store level efficiency. At the same time, the business also runs a restaurant arm and renewable energy operations that consume capital. Forecasts still point to earnings growth above the wider JP market, but the gap between those expectations and the most recent profit squeeze is where attention now needs to sit.
That said, there is one pressure point inside Kobe Bussan’s model that could matter far more than the latest quarter if ...
There's only one way to know the right time to buy, sell or hold Kobe Bussan. Head to Simply Wall St's company report for the latest analysis of Kobe Bussan's Fair Value.
Form Your Own Verdict
Disagree with this assessment? Extraordinary investment returns rarely come from following the herd, so go with your instincts.
- A great starting point for your Kobe Bussan research is our analysis highlighting 2 key rewards that could impact your investment decision.
- See our latest analysis for Kobe Bussan. The report includes a comprehensive fundamental analysis summarized in a single visual, the Snowflake, making it easy to evaluate Kobe Bussan's overall financial health at a glance.
Looking For More Investment Ideas Beyond Kobe Bussan?
If this latest update on Kobe Bussan leaves you wanting a broader watchlist, you can use the Simply Wall St Screener to test different styles and build a set of stocks that fits how you like to invest.
- For investors who focus on quality at a reasonable price, you can start with companies that appear mispriced on fundamentals through our 17 high quality undervalued stocks.
- If capital strength and staying power matter most to you, you can scan businesses with robust finances using the list of solid balance sheet and fundamentals (19 results).
- For those who prioritize income rather than headline growth, you can build a shortlist of yield-focused opportunities with the 18 dividend fortresses.
This article by Simply Wall St is general in nature. We provide commentary based on historical data and analyst forecasts only using an unbiased methodology and our articles are not intended to be financial advice. It does not constitute a recommendation to buy or sell any stock, and does not take account of your objectives, or your financial situation. We aim to bring you long-term focused analysis driven by fundamental data. Note that our analysis may not factor in the latest price-sensitive company announcements or qualitative material. Simply Wall St has no position in any stocks mentioned.
Have feedback on this article? Concerned about the content? Get in touch with us directly. Alternatively, email editorial-team@simplywallst.com