
- PRICING
- LIVE QUOTES
- LEARN
- HELP


EN
THOR Industries (THO) Could Be 19% Below Fair Value Following Leadership Reshuffle
THOR Industries (THO) reshuffled its senior ranks on 10 September 2026, installing new leaders across North American RV operations in a move that could influence investor sentiment toward the stock.
These leadership appointments come at a tricky point for THOR Industries, with the share price at US$72.86 and a 1-year total shareholder return that declined 28.87%. The year-to-date share price return fell 30.89%, and shorter term pressure, including a 7.77% 30-day share price drop, suggests that investors are still recalibrating expectations around risk and execution despite the management reshuffle.
Spot under-pressure leadership stories like THOR Industries early, then compare them with hand-picked RV and consumer cyclicals in the 15 high quality undiscovered gems.These leadership moves land at a time when THOR Industries shares have already absorbed a sharp reset in expectations. The key issue now is whether the reshuffle reflects deeper business pressures or simply sentiment overshooting on the downside.
Preferred P/E of 14.5x: Is it justified?
Valuation on THOR Industries today revolves around what investors are willing to pay for its earnings, with the stock trading on a P/E of 14.5x at a last close of $72.86. That level sits below both the wider US equity market and an internally estimated fair P/E. This frames the current weakness in the share price in a different light.
The P/E ratio compares THOR Industries' share price with its earnings per share and gives a quick sense of how much investors are paying for every dollar of profit. For a cyclical manufacturer selling recreational vehicles and components, this yardstick often captures how much confidence the market has in the durability of demand and the quality of recent profit trends.
On the numbers provided, THOR Industries trades on a P/E of 14.5x compared with a fair P/E estimate of 17.3x. This points to the market assigning a lower multiple than that model implies. The same 14.5x earnings multiple also sits below the broader US market at 18.4x, while sitting slightly above the global auto industry average of 14.2x. This signals that investors are pricing THOR at a discount to the market but not treating it as a distressed outlier inside its sector.
Result: Price-to-earnings of 14.5x (UNDERVALUED).
Explore the SWS fair ratio for THOR Industries.Still, THOR Industries faces real risk if demand for big ticket RVs softens further or if leadership changes disrupt dealer relationships that are already under pressure.
Find out about the key risks to this THOR Industries narrative.
Another view on THOR Industries valuation
The P/E impression of THOR Industries as undervalued clashes with a different lens. Our DCF model points to a future cash flow value of $33.53 per share versus the current $72.86, which screens as overvalued on that method.
This kind of split view, cheap on earnings yet expensive on cash flows, usually forces investors to ask which risk they are more comfortable with. Is the DCF too harsh on long term cash generation, or is the earnings multiple giving too much credit to a rebound that may not materialise?
Look into how the SWS DCF model arrives at its fair value.
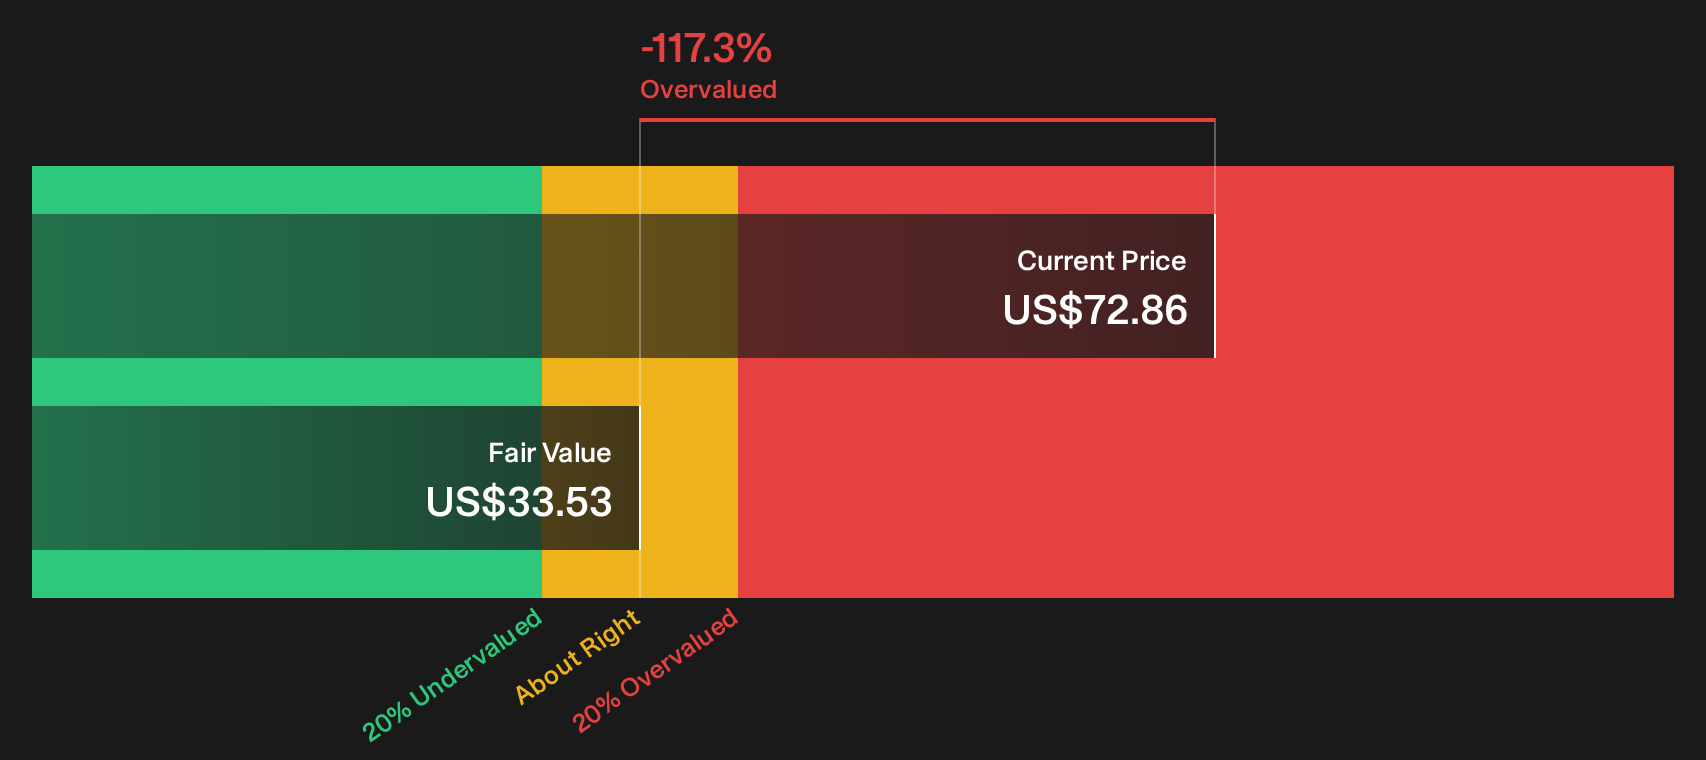
Simply Wall St performs a discounted cash flow (DCF) on every stock in the world every day (check out THOR Industries for example). We show the entire calculation in full. You can track the result in your watchlist or portfolio and be alerted when this changes, or use our stock screener to discover 32 high quality undervalued stocks. If you save a screener we even alert you when new companies match - so you never miss a potential opportunity.
Next Steps
If this mix of pressure and potential around THOR Industries leaves you undecided, consider reviewing the underlying data promptly to confirm whether the optimism is warranted. To see why some investors are still focusing on potential upside, take a closer look at the 4 key rewards.
Looking for more THOR Industries sized opportunities?
Do not stop at THOR Industries. Broaden your watchlist with focused stock ideas filtered by quality, income, and resilience so your capital is working as hard as you are.
- Target potential mispricing by reviewing companies that screen as both high quality and attractively valued in the 32 high quality undervalued stocks.
- Build a more reliable income stream by focusing on businesses that appear in the 6 dividend fortresses.
- Prioritise capital protection by filtering for companies that feature in the 11 resilient stocks with low risk scores.
This article by Simply Wall St is general in nature. We provide commentary based on historical data and analyst forecasts only using an unbiased methodology and our articles are not intended to be financial advice. It does not constitute a recommendation to buy or sell any stock, and does not take account of your objectives, or your financial situation. We aim to bring you long-term focused analysis driven by fundamental data. Note that our analysis may not factor in the latest price-sensitive company announcements or qualitative material. Simply Wall St has no position in any stocks mentioned.
Have feedback on this article? Concerned about the content? Get in touch with us directly. Alternatively, email editorial-team@simplywallst.com