
- PRICING
- LIVE QUOTES
- LEARN
- HELP


EN
Viohalco (ENXTBR:VIO) Slides Again After A Sharp Pullback But Still Looks Fairly Valued
Viohalco (ENXTBR:VIO) has drawn fresh attention after a recent pullback, with the share price down 1.2% on the day and roughly 8% over the past month.
Short term momentum for Viohalco looks weaker, with the share price down 3.5% over the past week and roughly 14.9% over three months. Yet the year to date share price return of 35.8% and a 1 year total shareholder return of about 141.6% still point to a stock that has rewarded patient holders even through recent volatility.
Broaden your watchlist beyond Viohalco by scanning a hand picked list from 183 high quality undervalued stocks that combine resilient cash generation with balance sheets built to handle sharp swings like these.
After that kind of run, followed by a sharp one-month slide, buying Viohalco on this dip may feel tempting. The real test is what the current valuation actually implies compared with waiting for a cleaner entry.
Preferred P/E of 13.3x for Viohalco: Is it justified?
On simple earnings terms, Viohalco trades on a P/E of 13.3x, which leaves the share price looking slightly cheaper than the wider European Metals and Mining group but a bit richer than its closer peer set.
The P/E ratio compares what the market is paying for each euro of current earnings. For a diversified industrial group like Viohalco, with activity across aluminium, copper, cables, steel and real estate, this measure gives a quick sense of how much investors are prepared to pay for its existing profit base.
Viohalco shows some mixed signals behind that headline multiple. Earnings rose 40.8% over the past year and have grown 3.4% per year over five years, current net profit margins sit at 4.1% compared with 3.2% last year, and management flags high quality earnings. At the same time, return on equity of 14% is described as low, the firm carries a high level of debt, and its share price has been more volatile than the Belgian market over three months.
Relative pricing adds another layer. Viohalco's 13.3x P/E is below the European Metals and Mining industry average of 14.7x, which suggests the wider sector trades on a richer earnings multiple. Yet the same 13.3x is above the peer average of 12.4x, which implies investors are still paying a premium compared with more direct comparables even after the recent pullback.
See what the numbers say about this price — find out in our valuation breakdown.
Result: Price-to-earnings of 13.3x (ABOUT RIGHT)
Still, the Viohalco story could be knocked off course by its high debt load and its exposure to cyclical demand across metals and construction end markets.
Find out about the key risks to this Viohalco narrative.
Another View on Viohalco’s Valuation
The earnings multiple paints Viohalco as roughly fairly priced, yet the SWS DCF model tells a very different story. That framework estimates future cash flow value at €3.85 per share versus a current price of €16.4, which points to a stock that screens as sharply overvalued. Which lens do you trust more for a long term decision?
Look into how the SWS DCF model arrives at its fair value.
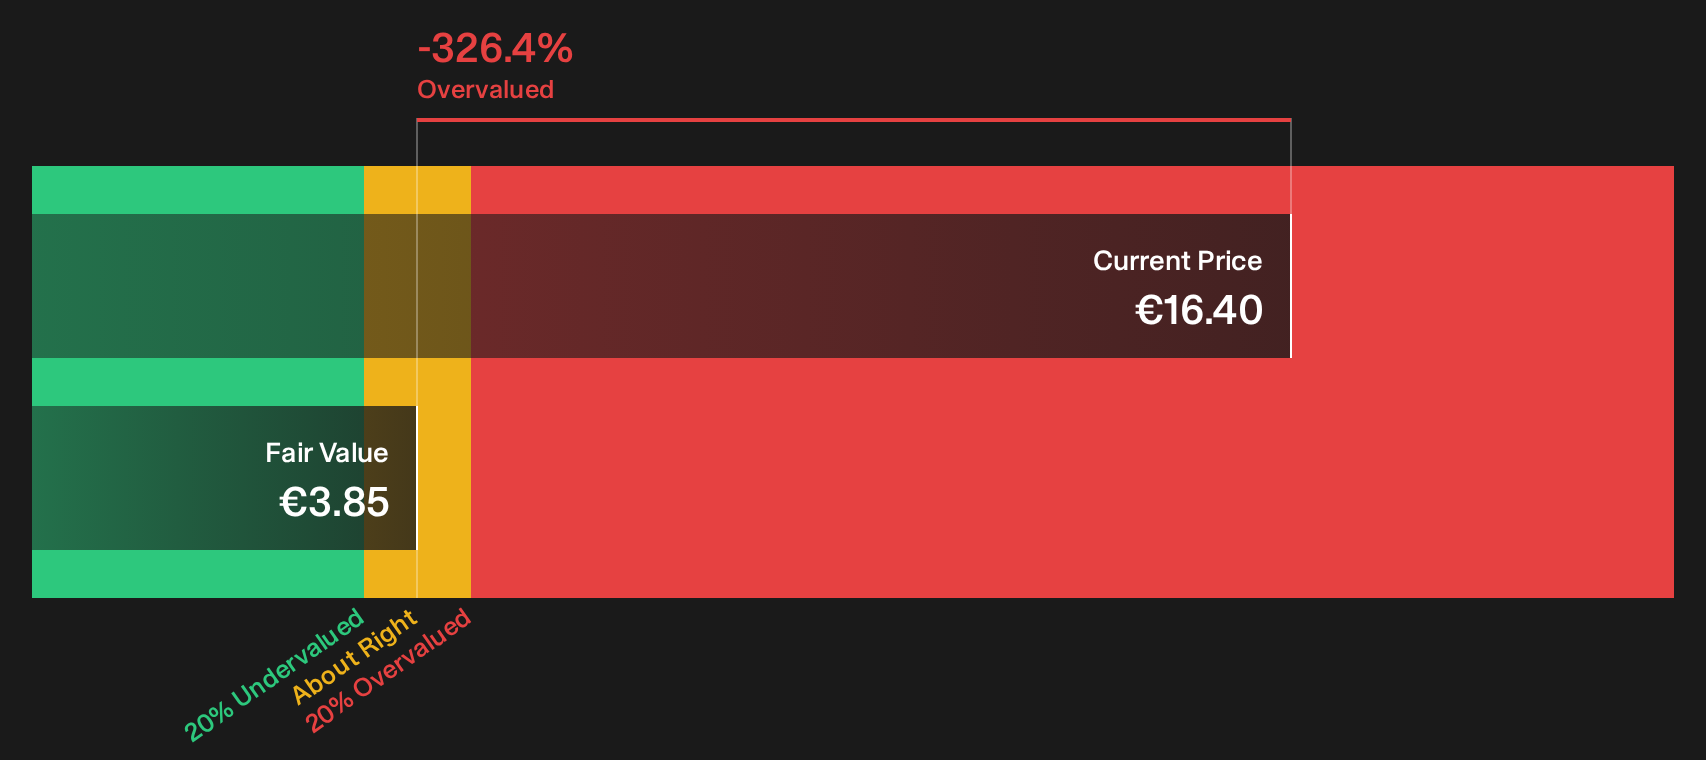
Simply Wall St performs a discounted cash flow (DCF) on every stock in the world every day (check out Viohalco for example). We show the entire calculation in full. You can track the result in your watchlist or portfolio and be alerted when this changes, or use our stock screener to discover 183 high quality undervalued stocks. If you save a screener we even alert you when new companies match - so you never miss a potential opportunity.
Next Steps
Unsure whether the recent pullback around Viohalco is an early warning or just noise in a strong run? Act while the data is fresh and weigh up both sides of the story by checking the 2 key rewards and 2 important warning signs.
Ready for more ideas beyond Viohalco?
Do not stop with Viohalco. Give yourself more options by lining up a fresh set of ideas that match different risk levels, income needs, and balance sheet strength.
- Target dependable balance sheets and financial resilience by scanning the list of solid balance sheet and fundamentals (194 results) that can handle rough patches without forcing rushed decisions.
- Hunt for quality at a reasonable price by checking the 183 high quality undervalued stocks that combine strong fundamentals with valuations that still look grounded.
- Build a watchlist of potential future favourites by reviewing the 617 high quality undiscovered gems before others start paying closer attention.
This article by Simply Wall St is general in nature. We provide commentary based on historical data and analyst forecasts only using an unbiased methodology and our articles are not intended to be financial advice. It does not constitute a recommendation to buy or sell any stock, and does not take account of your objectives, or your financial situation. We aim to bring you long-term focused analysis driven by fundamental data. Note that our analysis may not factor in the latest price-sensitive company announcements or qualitative material. Simply Wall St has no position in any stocks mentioned.
Have feedback on this article? Concerned about the content? Get in touch with us directly. Alternatively, email editorial-team@simplywallst.com