
- PRICING
- LIVE QUOTES
- LEARN
- HELP


EN
ASX Penny Stocks: Spotlight On Brookside Energy And Two Others
The Australian share market has recently faced challenges, with the ASX 200 experiencing its steepest weekly decline since March, driven by rising oil prices and bond yields alongside potential interest rate hikes. For investors willing to explore beyond the large-cap stocks, penny stocks—typically smaller or newer companies—continue to offer intriguing possibilities despite being considered niche. In this article, we spotlight Brookside Energy and two other penny stocks that present compelling opportunities through their financial resilience and potential for growth.
Below we spotlight a couple of our favorites from our exclusive screener.
Brookside Energy (ASX:BRK)
Simply Wall St Financial Health Rating: ★★★★★★
Overview: Brookside Energy Limited, with a market cap of A$43.53 million, is involved in the exploration, production, and appraisal of oil and gas projects in the United States through its subsidiaries.
Operations: Brookside Energy Limited has not reported any specific revenue segments.
Market Cap: A$43.53M
Brookside Energy Limited, with a market cap of A$43.53 million, is an exploration-focused company that recently reported half-year sales of A$24.03 million, down from A$35.37 million the previous year, and net income of A$0.50 million compared to A$5.8 million a year ago. Despite being unprofitable, it has reduced losses over five years and maintains a debt-free balance sheet with short-term assets exceeding liabilities by A$0.80 million and long-term liabilities by a significant margin. The company's shares have not faced meaningful dilution recently, and its management team is experienced with an average tenure of 2.8 years.
- Click here and access our complete financial health analysis report to understand the dynamics of Brookside Energy.
- Examine Brookside Energy's earnings growth report to understand how analysts expect it to perform.

OM Holdings (ASX:OMH)
Simply Wall St Financial Health Rating: ★★★★☆☆
Overview: OM Holdings Limited is an investment holding company involved in the mining, smelting, trading, and marketing of manganese ores and ferroalloys globally, with a market capitalization of A$160.51 million.
Operations: The company generates revenue primarily from its Marketing and Trading segment, which accounts for $654.79 million, followed by the Smelting segment contributing $465.84 million.
Market Cap: A$160.51M
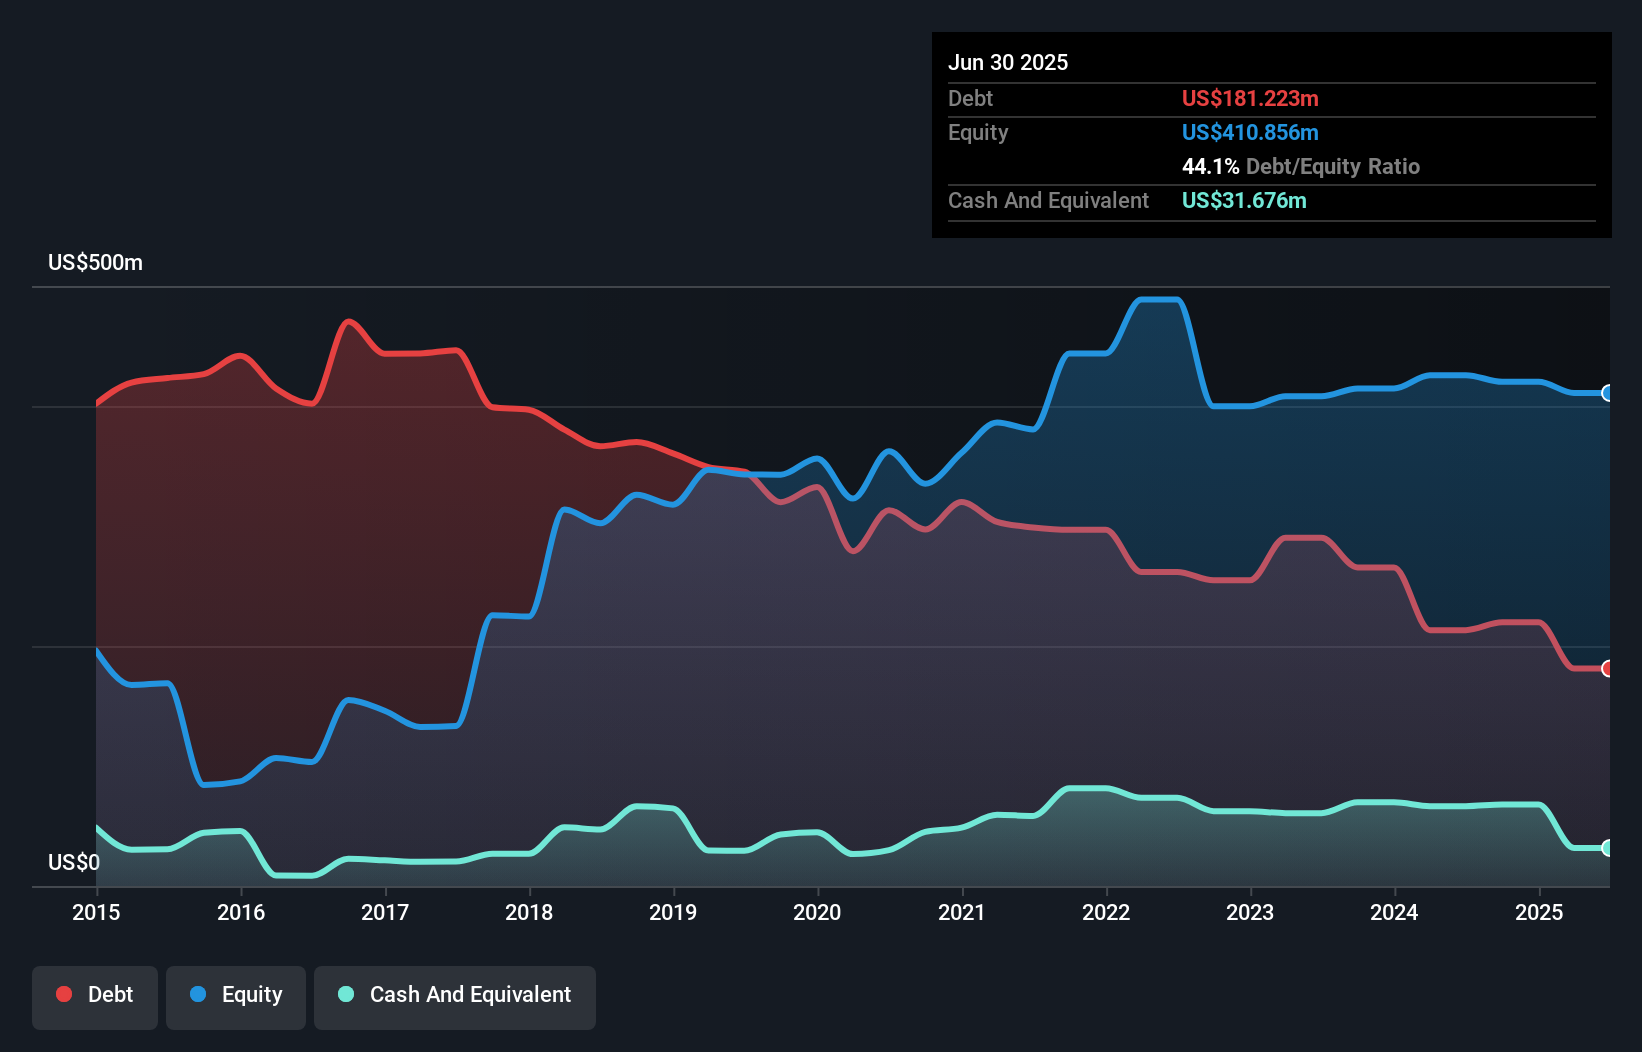
OM Holdings Limited, with a market cap of A$160.51 million, reported half-year sales of US$265.23 million, down from US$309.28 million the previous year, but achieved a net income of US$26.32 million compared to a net loss previously. Despite being unprofitable over the past five years with increasing losses and negative return on equity (-3.19%), the company has managed to reduce its debt-to-equity ratio significantly from 78.5% to 39.8%. Short-term assets comfortably outweigh liabilities, but operating cash flow remains negative and interest coverage is weak at 0.4x EBIT, indicating potential financial strain despite seasoned board leadership averaging 16.4 years in tenure.
- Unlock comprehensive insights into our analysis of OM Holdings stock in this financial health report.
- Explore historical data to track OM Holdings' performance over time in our past results report.
Simonds Group (ASX:SIO)
Simply Wall St Financial Health Rating: ★★★★★☆
Overview: Simonds Group Limited, with a market cap of A$57.59 million, designs, constructs, and sells residential dwellings in Australia.
Operations: The company generates revenue primarily through its Residential Construction segment, which accounted for A$729.15 million.
Market Cap: A$57.59M
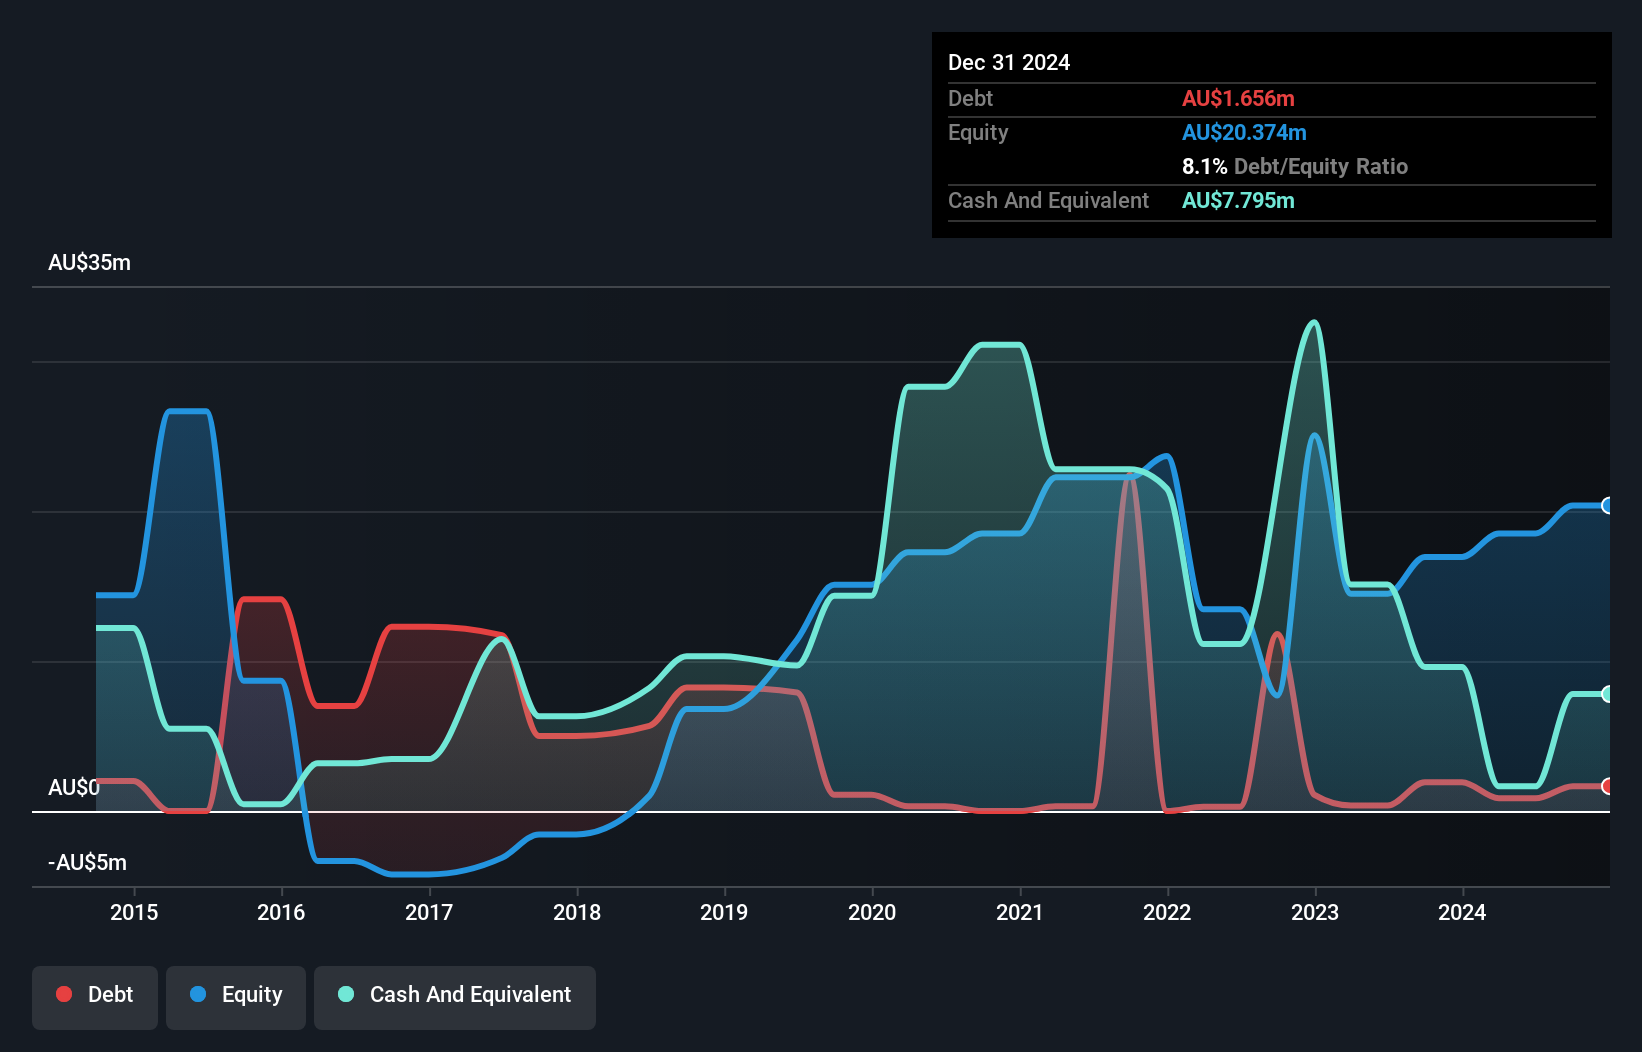
Simonds Group Limited, with a market cap of A$57.59 million, has shown significant financial improvement in its recent earnings report. The company reported sales of A$729.15 million and net income of A$10.45 million for the full year ended June 30, 2026, marking a substantial increase from the previous year’s figures. Despite high share price volatility over the past three months, Simonds maintains strong financial health with short-term assets exceeding both short and long-term liabilities and more cash than total debt. Additionally, their return on equity is notably high at 36.3%, supported by well-covered interest payments and operating cash flow covering debt effectively.
- Click to explore a detailed breakdown of our findings in Simonds Group's financial health report.
- Evaluate Simonds Group's historical performance by accessing our past performance report.
Make It Happen
- Click through to start exploring the rest of the 390 ASX Penny Stocks now.
- Looking For Alternative Opportunities? We've found 7 US stocks that are forecast to pay a dividend yeild of over 6% next year. See the full list for free.
This article by Simply Wall St is general in nature. We provide commentary based on historical data and analyst forecasts only using an unbiased methodology and our articles are not intended to be financial advice. It does not constitute a recommendation to buy or sell any stock, and does not take account of your objectives, or your financial situation. We aim to bring you long-term focused analysis driven by fundamental data. Note that our analysis may not factor in the latest price-sensitive company announcements or qualitative material. Simply Wall St has no position in any stocks mentioned.
Have feedback on this article? Concerned about the content? Get in touch with us directly. Alternatively, email editorial-team@simplywallst.com