
- PRICING
- LIVE QUOTES
- LEARN
- HELP


EN
Brown & Brown (BRO) Pulls Back, Is The Undervaluation Case Still Convincing?
Brown & Brown (BRO) has drawn attention after recent trading left the stock down about 6% over the past month, even as its past 3 months performance shows a gain of roughly 12%.
At a share price of $66.19, Brown & Brown has seen momentum cool, with the 7-day share price return down 7.3% and the 30-day share price return down 6.2%. The 90-day share price return is still up 11.7%, while the 1-year total shareholder return is down 28.6% and the 5-year total shareholder return remains positive at 20.3%.
Compare Brown & Brown's recent pullback with other insurance brokers by scanning the hand-picked 11 resilient stocks with low risk scores that have held up better in choppy trading.
So is Brown & Brown’s recent slide signalling something about the underlying insurance operation, or just a reset in how investors feel about the stock at this price? The valuation numbers give the clearer clue.
Most Popular Narrative: 12.5% Undervalued
Against Brown & Brown's last close of $66.19, the most followed narrative pegs fair value at $75.63, implying a meaningful valuation gap that hinges on specific growth and margin assumptions.
The company's effective cost management and debt repayment strategies have led to reduced interest expenses and an improved EBITDAC margin by 110 basis points. This focus on managing financial liabilities could enhance future net margins and earnings.
Read the complete narrative. Read the complete narrative.
Want to know what kind of revenue trajectory and profit profile support that higher valuation for Brown & Brown? The narrative leans on sustained top line expansion, slightly leaner margins, and a future earnings multiple that sits above the broader insurance pack. Curious how those ingredients combine into that single fair value number.
Result: Fair Value of $75.63 (UNDERVALUED)
Have a read of the narrative in full and understand what's behind the forecasts.
Still, the narrative around Brown & Brown can crack if pharmacy and medical costs keep outpacing pricing, or if regulatory shifts in key states lift claims costs.
Find out about the key risks to this Brown & Brown narrative.
Another View: Brown & Brown On Earnings-Based Pricing
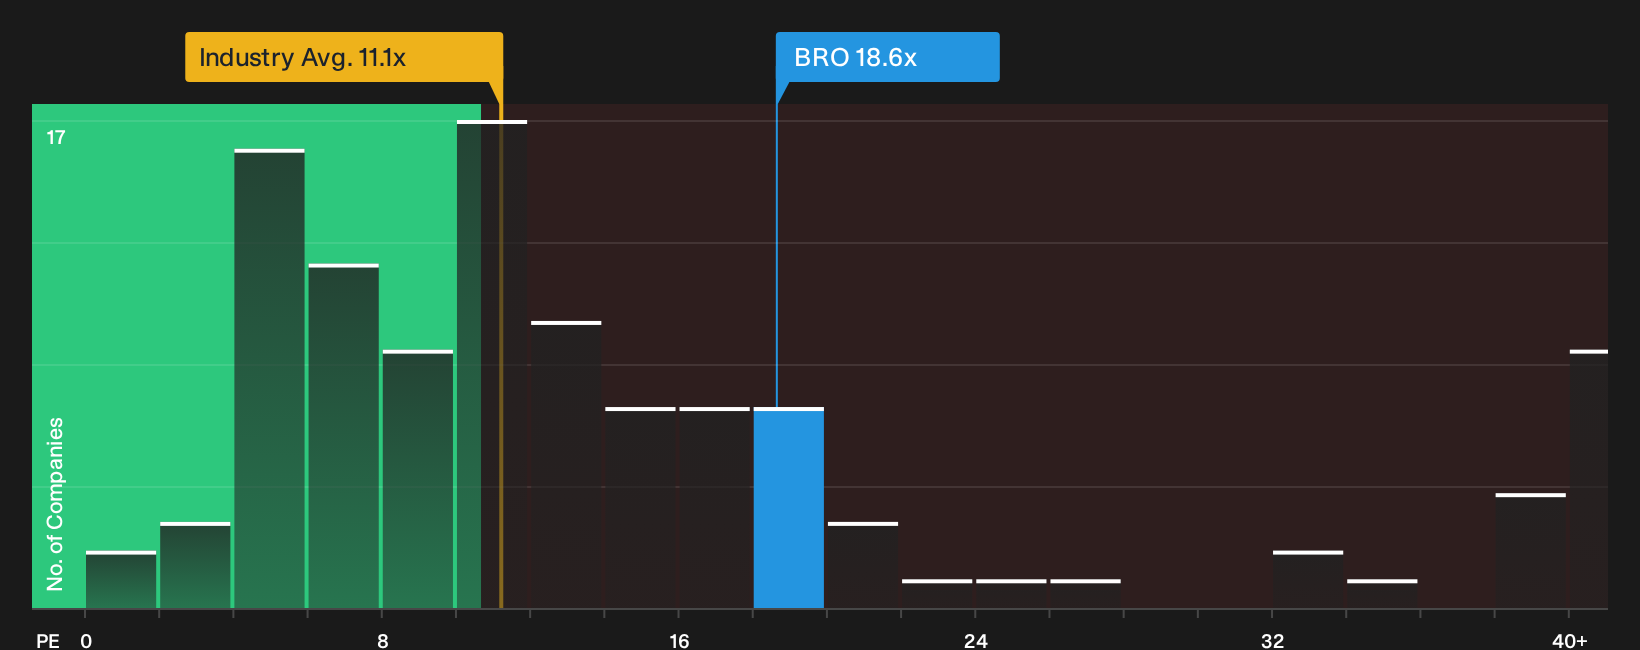
The SWS DCF model points to strong upside for Brown & Brown, yet the simpler earnings yardstick paints a cooler picture. The shares trade on a P/E of 18.6x, which is richer than the US Insurance sector at 11.1x and above a fair ratio of 12.6x. That gap suggests you could be paying up for quality today. How comfortable are you if sentiment or growth assumptions reset from here?
See what the numbers say about this price, find out in our valuation breakdown.See what the numbers say about this price — find out in our valuation breakdown.
Next Steps
Sentiment on Brown & Brown is clearly split, with some investors focused on risks and others pointing to upside potential. Move quickly, review the evidence, and weigh the 2 key rewards and 2 important warning signs.
Looking for more Brown & Brown investment ideas?
If Brown & Brown has your attention, do not stop here. The next advantage often comes from spotting one more opportunity others ignore.
- Target potential bargains by scanning companies that combine quality fundamentals with attractive pricing through our curated list of 32 high quality undervalued stocks.
- Build a steadier income stream by reviewing businesses screened for reliable, higher-yield payouts in the 6 dividend fortresses.
- Strengthen your watchlist by focusing on businesses with robust finances using the list of solid balance sheet and fundamentals (23 results).
This article by Simply Wall St is general in nature. We provide commentary based on historical data and analyst forecasts only using an unbiased methodology and our articles are not intended to be financial advice. It does not constitute a recommendation to buy or sell any stock, and does not take account of your objectives, or your financial situation. We aim to bring you long-term focused analysis driven by fundamental data. Note that our analysis may not factor in the latest price-sensitive company announcements or qualitative material. Simply Wall St has no position in any stocks mentioned.
Have feedback on this article? Concerned about the content? Get in touch with us directly. Alternatively, email editorial-team@simplywallst.com