
- PRICING
- LIVE QUOTES
- LEARN
- HELP


EN
Steel Dynamics (STLD) Stock Looks Reasonable Even After A 317% Run
Steel Dynamics has had a powerful five year run, yet both an intrinsic value estimate using a Discounted Cash Flow (DCF) approach and market multiples still point to the stock trading below what the business may be worth. Recent pullbacks sit against very strong longer term gains, which makes the current price a live question for anyone trying to anchor on valuation rather than momentum.
- Over the past five years, Steel Dynamics has returned about 317.3%, which puts a lot of past gains on the table and makes today’s entry point more sensitive to valuation assumptions.
- Future cash generation from steel demand and margins can support the current market value, while any sustained hit to profitability or cash flow timing would quickly weaken the case that the shares are cheap.
- The broader checks give Steel Dynamics a mixed value score, 3 out of 6, so it screens as neither a clear bargain nor clearly overpriced on a composite basis.
The issue now is whether the current discount to intrinsic value is enough to compensate you for the risks in Steel Dynamics after such a strong multi year share price performance.
Compare Steel Dynamics’ sharp five year run and current valuation signals with a curated list of resilient value ideas in the 32 high quality undervalued stocks.
Is Steel Dynamics a Bargain on Cash Flow?
The Discounted Cash Flow model here projects what Steel Dynamics could reasonably earn for shareholders based on its future free cash generation. Latest twelve month free cash flow sits at about $44.6m, so the valuation leans heavily on the expectation that cash output changes from this base rather than staying where it is today.
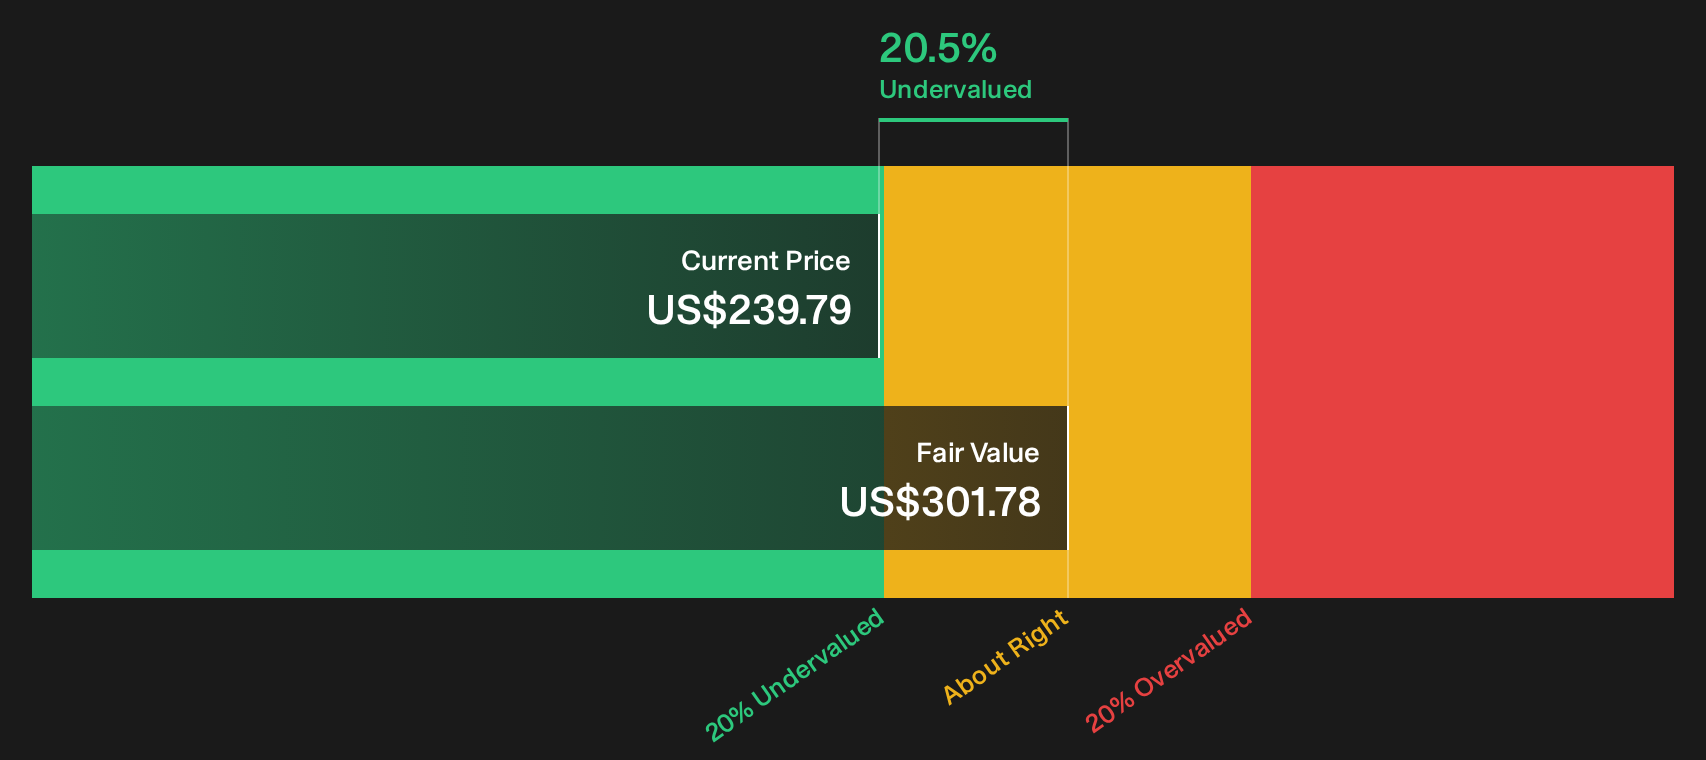
Analyst forecasts in the model point to different free cash flow levels over the next few years. Based on those projections, the DCF points to an estimated intrinsic value of about $302 per share in dollar terms. Compared with the current share price, the model implies the stock trades at roughly a 20.5% discount.
On these cash flow assumptions, Steel Dynamics stock appears undervalued relative to the DCF estimate.
Our Discounted Cash Flow (DCF) analysis suggests Steel Dynamics is undervalued by 20.5%. Track this in your watchlist or portfolio, or discover 32 more high quality undervalued stocks.
Is Steel Dynamics Still Cheap on Earnings?
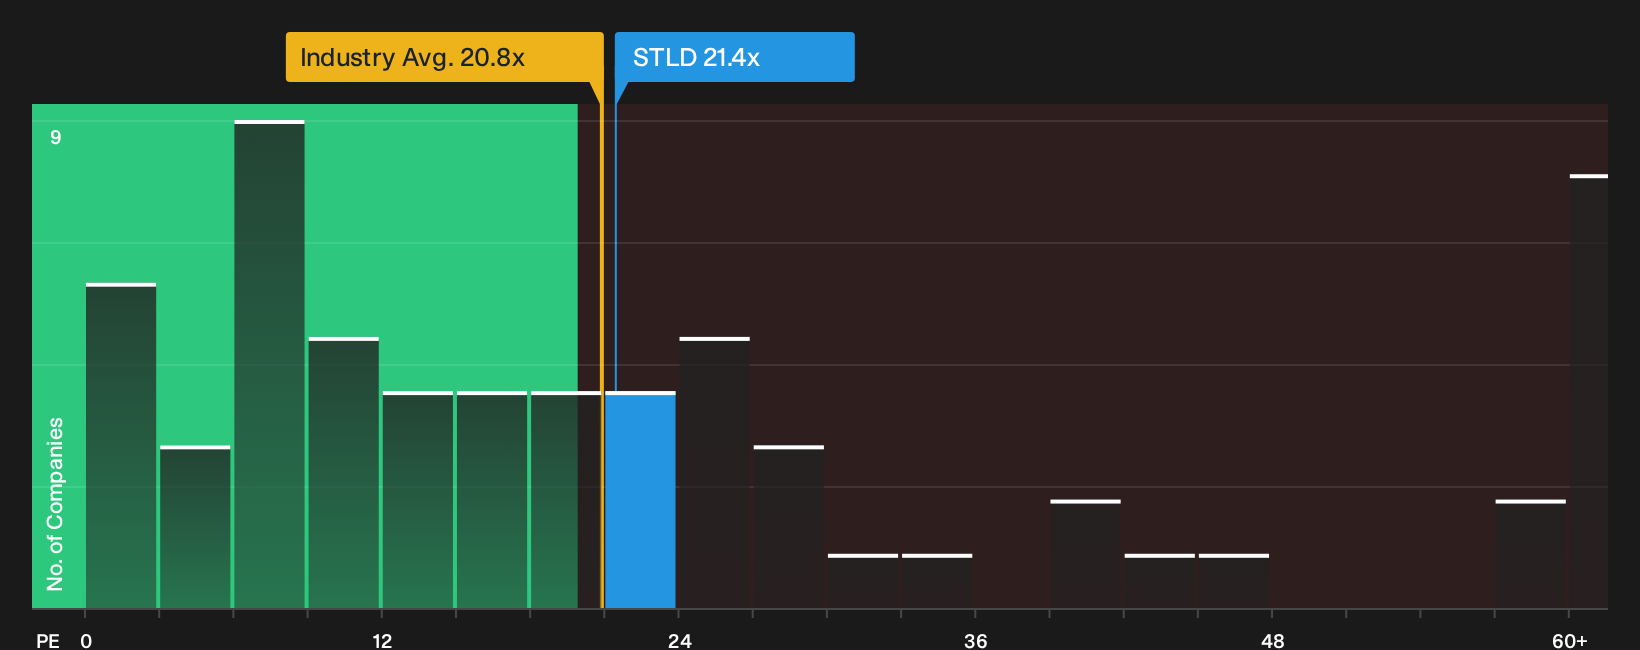
The P/E ratio is a natural fit for Steel Dynamics because earnings power is central to how investors tend to value a cyclical producer like this. On current numbers, the stock trades at about 21.4x earnings. That sits slightly above the broader metals and mining industry average of roughly 20.8x, and above a peer group average of about 17.9x.
The fair P/E ratio implied by the model is about 24.8x, which is higher than where Steel Dynamics trades today. That gap suggests the earnings multiple does not fully reflect the company’s profile once factors such as size, margins and risk are blended together. Compared with both peers and the tailored fair P/E, the market is giving Steel Dynamics only a modest premium, while the framework points to room for a richer earnings multiple.
On this P/E yardstick, Steel Dynamics stock appears undervalued relative to the earnings multiple the model indicates as reasonable.
See what the numbers say about this price — find out in our valuation breakdown.
The Steel Dynamics Narrative: What Would Justify Today's Price?
Steel Dynamics' valuation puzzle only really comes into focus once you spell out which future path on earnings, margins and growth would need to play out for the stock to be worth meaningfully more or less than it trades for today, and that is what Simply Wall St Narratives on the Community page aim to map out. Each scenario ties a fair value estimate to a specific storyline about Steel Dynamics' possible catalysts and pressure points so you can track which version appears to be unfolding over time.
Community views on Steel Dynamics stretch from tight supply supporting years of solid earnings to rich pricing that could prove hard to defend.
Bull case: 23% undervalued
"Record quarterly steel shipments of 3.6 million tons and 89% utilization, compared with an estimated North American industry rate of 77%, highlight the benefit of linked mills, fabrication and recycling operations..."
Read the full Bull Case to see why Steel Dynamics could be undervalued
Bear case: 6% overvalued
"The business model leans heavily on high utilization, with steel mills running at 89% versus an industry rate of 77%, so any extended dip in end market demand for long products, nonresidential construction or automotive could pull utilization closer to industry levels and weigh on operating income and net margins..."
Read the full Bear Case to see why Steel Dynamics could be overvalued
Do you think there's more to the story for Steel Dynamics? Head over to our Community to see what others are saying!
The Bottom Line
Steel Dynamics screens as undervalued on both the Discounted Cash Flow (DCF) intrinsic value estimate and the tailored P/E framework, despite a very sharp prior move in the share price. The gap between market price and those models only matters if future cash generation and earnings power roughly match the assumptions embedded in them. The crux is whether utilization and margins can hold up well enough for that intrinsic value case to stay intact rather than slip into value trap territory. Your call now largely comes down to how confident you are that profitability and cash conversion remain resilient through the cycle.
This article by Simply Wall St is general in nature. We provide commentary based on historical data and analyst forecasts only using an unbiased methodology and our articles are not intended to be financial advice. It does not constitute a recommendation to buy or sell any stock, and does not take account of your objectives, or your financial situation. We aim to bring you long-term focused analysis driven by fundamental data. Note that our analysis may not factor in the latest price-sensitive company announcements or qualitative material. Simply Wall St has no position in any stocks mentioned.
Have feedback on this article? Concerned about the content? Get in touch with us directly. Alternatively, email editorial-team@simplywallst.com