
- PRICING
- LIVE QUOTES
- LEARN
- HELP


EN
3 Exchange Stocks Retail Investors May Watch When Options Trading Picks Up
When the S&P 500’s Shiller P/E climbs to about 41 while long-term averages sit far lower, crash talk gets loud and investors start rethinking risk. Elevated valuations, record margin debt and higher Treasury yields can push more traders toward hedging and options activity. This article looks at 3 stocks from a volatility and options market infrastructure screener that appear most exposed to that story, for better or worse.
The three stocks highlighted below are just a starting sample from this volatility and options market infrastructure theme. The full screen surfaced 8 more companies with equally detailed stories that are not covered here.
If you want to move straight from theory to ideas you can work with, use the Listed Volatility and Options Market Infrastructure Providers screener to identify, compare and analyze potential higher conviction candidates that fit your own risk and return preferences.
Bolsas y Mercados Argentinos (BASE:BYMA)
Overview: Bolsas y Mercados Argentinos operates Argentina’s main stock exchange and clearing infrastructure, earning fee income from trading, listings, custody and related post trade services that tend to be closely watched when volatility and hedging activity pick up.
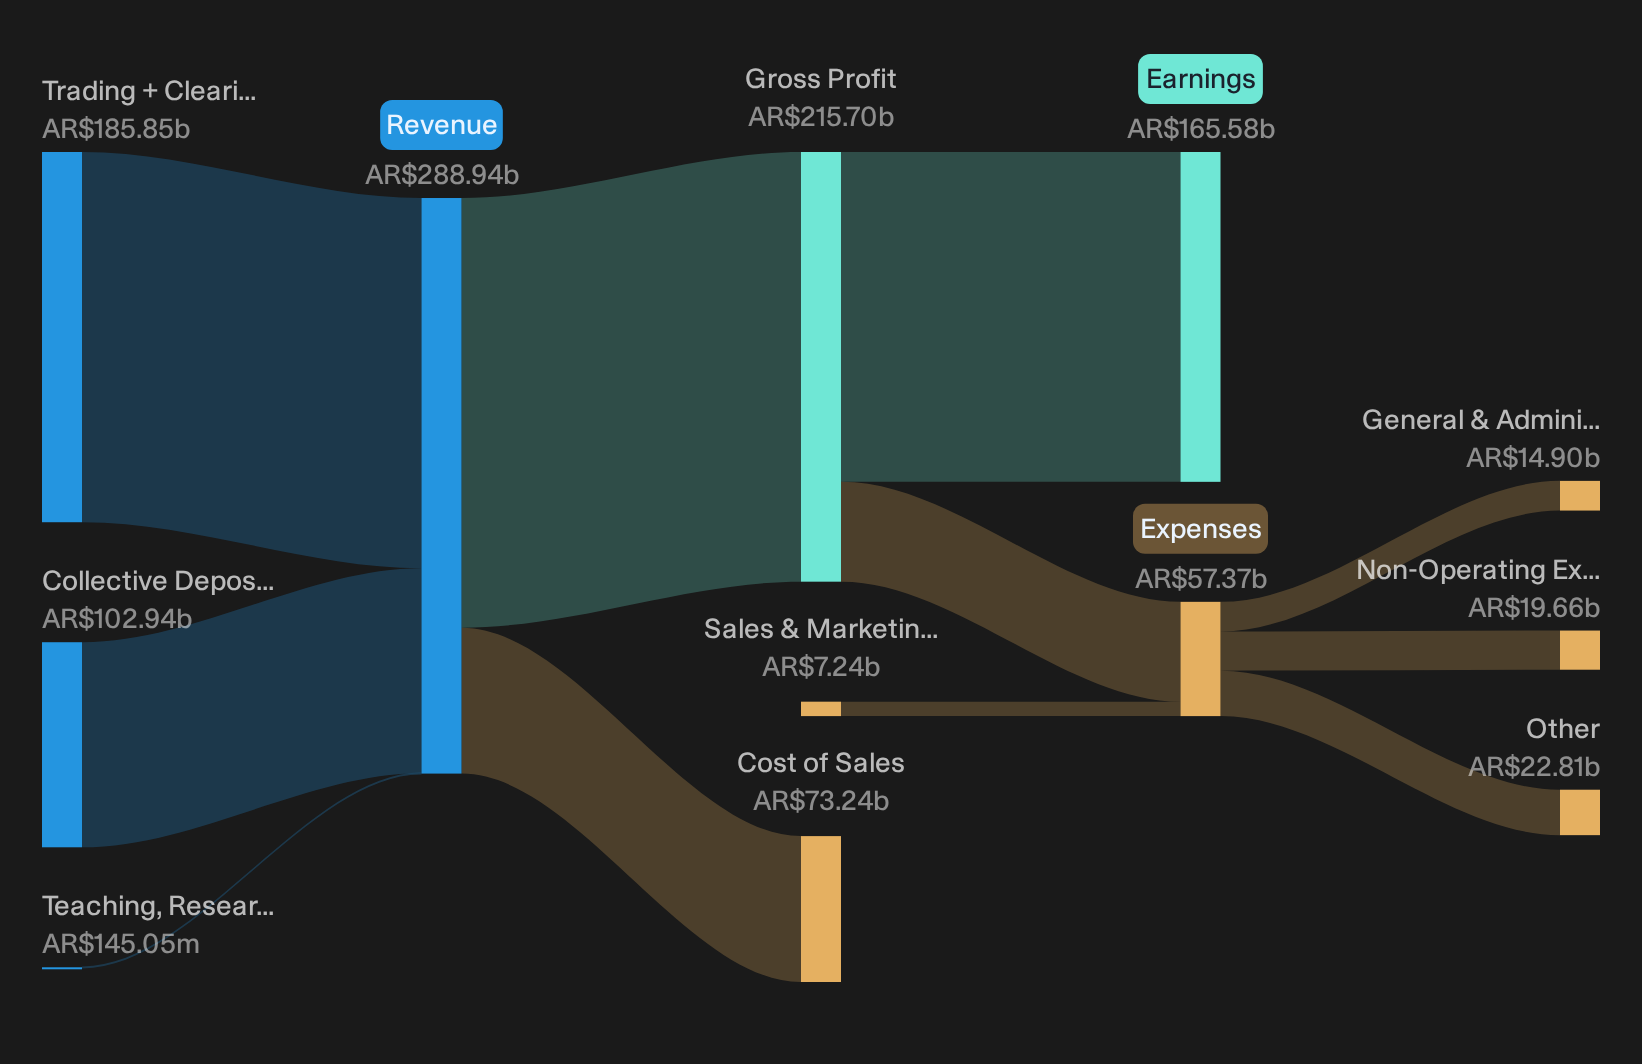
Operations: Most income comes from Argentina, with about ARS185.9b from trading, clearing and central counterparty services and ARS102.9b from collective deposit activities, while teaching and training contribute a very small ARS145 million.
Market Cap: ARS2.1t
For investors looking for ways to express a view on volatility itself rather than just index direction, Bolsas y Mercados Argentinos offers exposure to the core market infrastructure where trading, clearing and custody services sit at the centre of how local investors hedge and reposition.
"Expansion of assets under custody across government securities, corporate bonds, CEDEARs and SME instruments is increasing the relevance of the CSD segment. This can support higher custody and ancillary service revenue and a larger share of group earnings over time."
The main question now is how ongoing cost and efficiency pressures shape margins if trading and custody demand shift again.
That margin question is exactly what the full narrative for Bolsas y Mercados Argentinos unpacks, including how Bolsas y Mercados Argentinos could leverage custody growth if trading volumes stall or accelerate again.
flatexDEGIRO (XTRA:FTK)
Overview: flatexDEGIRO runs a large European online brokerage that gives retail investors direct access to securities, options and other listed trading.
Operations: Revenue mainly comes from the DEGIRO segment at €360.5 million and the flatex unit at €343.7 million, partly offset by €82.7 million consolidation effects.
Market Cap: €3.4b
flatexDEGIRO matters for this volatility and options infrastructure theme because it channels retail trading and hedging flows directly into listed markets when swings in indices make protection and opportunistic trading more attractive.
"The ongoing and planned introduction of new products such as crypto trading and securities lending (with regulatory and technical groundwork already complete for imminent rollout to major markets) is intended to support product diversification, broader revenue streams and potentially higher net margins and recurring revenues in the medium term."
What happens to those ambitions if a single pressure point changes how often clients trade and how many products they actually use?
If that trading intensity question is front of mind, the full narrative for flatexDEGIRO outlines how flatexDEGIRO’s product mix, client activity and risk factors could interact if volatility accelerates again.

Singapore Exchange (SGX:S68)
Overview: Singapore Exchange runs integrated securities and derivatives markets in Singapore, offering trading, clearing and listed options used for hedging volatility.
Operations: Singapore Exchange generates about S$508 million from Equities Cash, S$375 million from Equities Derivatives, S$412 million from Fixed Income, Currencies and Commodities, and S$265 million from Platform and Others, almost entirely in Singapore.
Market Cap: S$26.0b
Singapore Exchange gives you a direct line into where hedging demand meets trading activity, as investors respond to stretched valuations and elevated crash risk with greater use of listed equity and index derivatives.
"Expansion into multiple asset classes and innovative products diversifies revenue streams and supports SGX's role as a gateway for global investors."
An important factor from here is how evolving conditions in funding and risk appetite influence future volumes and pricing power.
That turning point is exactly where the full narrative for Singapore Exchange steps in, mapping how Singapore Exchange could see volumes, pricing and risk appetite decouple from headline indices.

Seeking Alternatives Before Volatility Shifts?
Fresh ideas often move first when volatility changes, momentum rotates and crowded trades start dropping. Scan curated stock sets that are under the radar for now to explore these ideas early.
- Spot fast-moving high yield opportunities by running the 161 dividend fortresses while payouts still appear secure relative to balance sheets and before income-focused investors concentrate on the same positions.
- Track potential quality growth by reviewing the 619 high quality undiscovered gems before improving fundamentals are fully reflected in valuations and before momentum traders respond.
- Explore companies linked to structural AI demand by filtering through the 89 AI infrastructure stocks while capital spending stories remain relatively new and are not yet widely incorporated into prices.
This article by Simply Wall St is general in nature. We provide commentary based on historical data and analyst forecasts only using an unbiased methodology and our articles are not intended to be financial advice. It does not constitute a recommendation to buy or sell any stock, and does not take account of your objectives, or your financial situation. We aim to bring you long-term focused analysis driven by fundamental data. Note that our analysis may not factor in the latest price-sensitive company announcements or qualitative material. Simply Wall St has no position in any stocks mentioned.
Have feedback on this article? Concerned about the content? Get in touch with us directly. Alternatively, email editorial-team@simplywallst.com