
- PRICING
- LIVE QUOTES
- LEARN
- HELP


EN
Mazda Motor (TSE:7261) Could Be 21% Undervalued On Fresh Value Stock Focus
Recent valuation-focused coverage on Mazda Motor (TSE:7261) has put the spotlight on its earnings prospects and comparative pricing versus other automakers, giving investors fresh reason to reassess the stock’s current trading levels.
Over the past year, Mazda Motor’s share price has moved around, with a recent 1-day share price return of 1.69% after a weaker year-to-date share price return that is down 8.47%. However, the 1-year total shareholder return of 9.07% suggests dividends and reinvested income have softened the impact of earlier price weakness and left longer term holders with mixed but still positive momentum.
Scan for more potential value stories like Mazda Motor by reviewing the hand picked 17 high quality undervalued stocks that currently combine compressed valuations with solid underlying business quality.
Mazda Motor’s recent pullback has reset expectations just as many valuation metrics still flag a discount to its implied worth. Has most of the easy upside already played out, or is the value gap only starting to close?
Price-to-Earnings of 6.7x: Is it justified?
Mazda Motor trades on a P/E of 6.7x while also screening as good value across several benchmarks, which points to a market price that lags its recent earnings recovery.
The P/E ratio compares what investors pay for each unit of profit, so a 6.7x multiple suggests the market is attaching a relatively low price to Mazda Motor’s current earnings power compared with many listed businesses.
Analysts estimate a fair P/E of 13.6x for Mazda Motor, which is about double the present level and materially higher than where the shares change hands today. The same stock also screens cheaply versus the Asian auto industry average P/E of 14.2x and an even higher peer group average of 21.4x. This indicates investors are pricing its earnings well below both sector and peer benchmarks and leaving room for that discount to narrow if sentiment shifts.
Explore the SWS fair ratio for Mazda Motor.
Result: Price-to-Earnings of 6.7x (UNDERVALUED)
Still, Mazda Motor faces real threats if global auto demand cools or if the Japan-heavy revenue mix amplifies currency swings and regional economic shocks.
Find out about the key risks to this Mazda Motor narrative.
Another View on Mazda Motor’s Value
The P/E story is only one angle. Our DCF model suggests Mazda Motor at ¥1,140 trades below an estimated future cash flow value of ¥1,453.3, which also points to an undervalued stock. If both earnings and cash flow lenses agree, is the discount a cushion or a trap for late buyers?
Look into how the SWS DCF model arrives at its fair value.
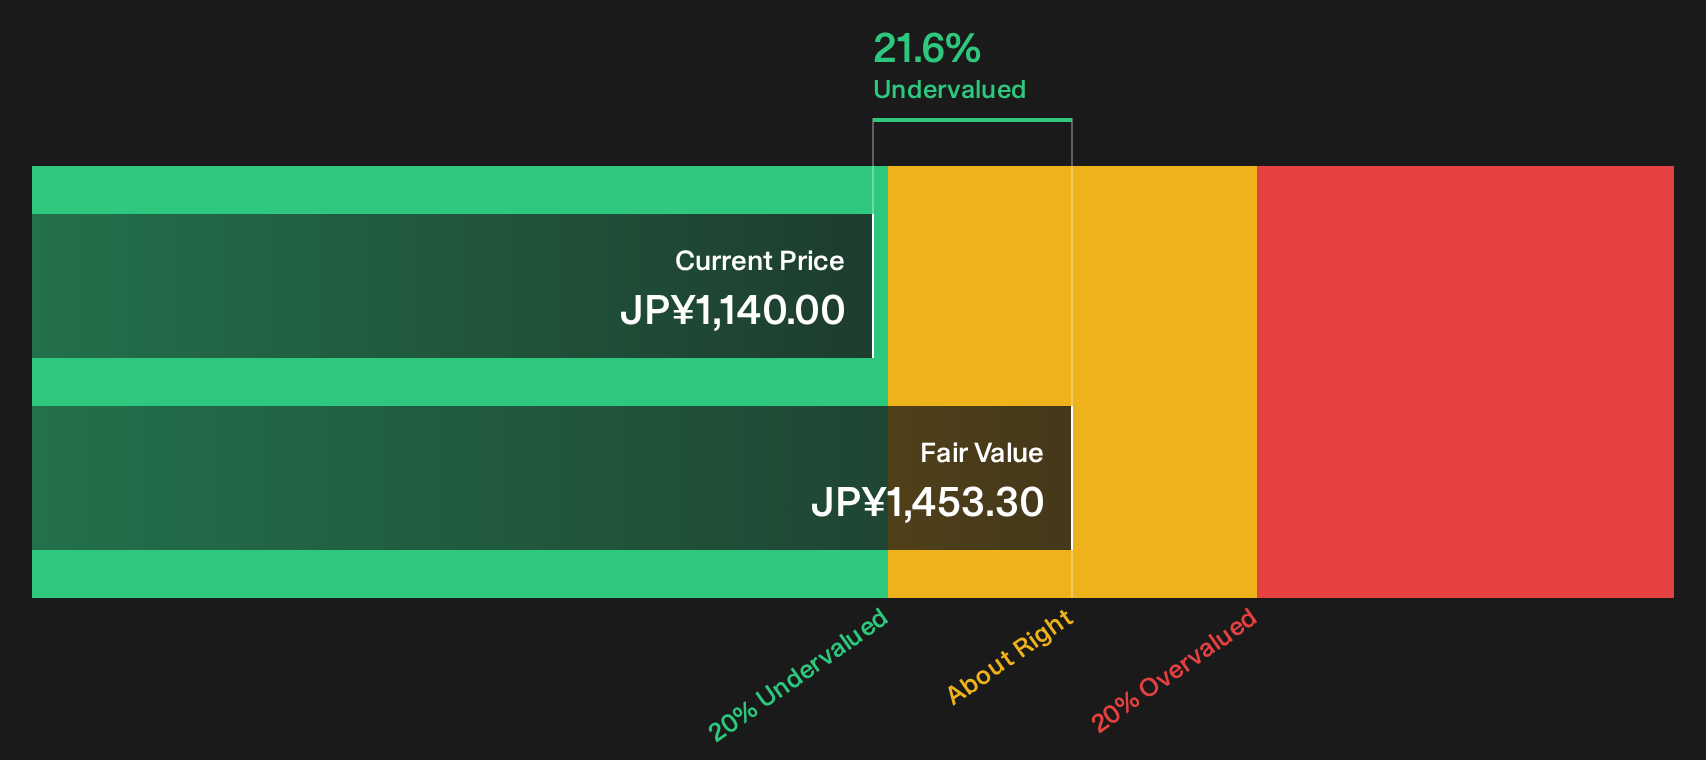
Simply Wall St performs a discounted cash flow (DCF) on every stock in the world every day (check out Mazda Motor for example). We show the entire calculation in full. You can track the result in your watchlist or portfolio and be alerted when this changes, or use our stock screener to discover 17 high quality undervalued stocks. If you save a screener we even alert you when new companies match - so you never miss a potential opportunity.
Next Steps
Sentiment around Mazda Motor is mixed, with clear risks on one side and real positives on the other. Move quickly, weigh the data yourself, then use the 4 key rewards and 2 important warning signs.
Looking for more investment ideas beyond Mazda Motor?
Do not stop with one opportunity. Broaden your watchlist now and give yourself more ways for your research to pay off over the long run.
- Target higher yield potential by reviewing income focused ideas inside the 19 dividend fortresses that might suit a portfolio built around regular cash returns.
- Spot robust balance sheets early by working through the list of solid balance sheet and fundamentals (19 results) so you can focus on businesses with financial cushions in place.
- Hunt for tomorrow's standouts by scanning the 73 high quality undiscovered gems before the wider market starts paying closer attention.
This article by Simply Wall St is general in nature. We provide commentary based on historical data and analyst forecasts only using an unbiased methodology and our articles are not intended to be financial advice. It does not constitute a recommendation to buy or sell any stock, and does not take account of your objectives, or your financial situation. We aim to bring you long-term focused analysis driven by fundamental data. Note that our analysis may not factor in the latest price-sensitive company announcements or qualitative material. Simply Wall St has no position in any stocks mentioned.
Have feedback on this article? Concerned about the content? Get in touch with us directly. Alternatively, email editorial-team@simplywallst.com