
- PRICING
- LIVE QUOTES
- LEARN
- HELP


EN
Is Innoviva (INVA) A Bargain As Conference Appearances Put Valuation Back In Focus?
Innoviva (INVA) is stepping into a busy week on the healthcare conference circuit, with investor presentations scheduled at Citigroup’s Biopharma Back to School Summit and the Cantor Fitzgerald Global Healthcare Conference in New York.
At a share price of $20.66, Innoviva has seen short term momentum ease, with the 30 day share price return down 2.5% and the 90 day move down 7.9%, while the 3 year total shareholder return of 64.5% still reflects a materially stronger long term outcome.
Scan beyond Innoviva and explore other healthcare specialists that investors are watching by reviewing the curated list in our list of solid balance sheet and fundamentals (23 results).
Recent weakness leaves Innoviva trading below its recent highs, which raises a simple choice: Is the current dip enough of a cushion, or does the valuation still argue for patience before adding exposure?
Price-to-Earnings of 4.2x: Is it justified?
Innoviva is currently on a P/E of 4.2x, which puts a low tag on each dollar of earnings compared with many listed healthcare peers.
The P/E ratio measures how much investors are paying today for each unit of reported profit. This matters for a business like Innoviva that earns substantial royalty and product income. A lower multiple can signal that the market is pricing in softer future earnings, or that it is skeptical about how repeatable current profit levels are.
Recent numbers show a very large jump in earnings over the past year and net profit margins of 81.2% compared with 10.4% a year earlier. At the same time, analysts expect earnings to decline by an average of 11.4% per year over the next three years, and there is limited agreement between those forecasts. That mix of high reported profitability and forecast earnings pressure helps explain why the market may be assigning a restrained P/E, even though the business currently generates returns on equity of 29%.
Relative to the US Pharmaceuticals industry average P/E of 15.5x, Innoviva trades on a much lower rating. The stock also screens as inexpensive compared with an estimated fair P/E of 10.4x. This is a level the market could move toward if sentiment and earnings expectations line up more closely with current profitability trends.
Explore the SWS fair ratio for Innoviva.
Result: Price-to-Earnings of 4.2x (UNDERVALUED)
Still, Innoviva relies heavily on a concentrated royalty stream and faces pressure from forecast earnings declines, which could quickly change sentiment if expectations reset.
Find out about the key risks to this Innoviva narrative.
Another View on Innoviva’s Value
The earlier P/E check paints Innoviva as inexpensive. A second lens tells a similar story. Our DCF model values the future cash flows at $55.33 per share, compared with the current $20.66 price, which points to a wide undervaluation gap.
That is a big difference for any healthcare stock. It raises a simple question for investors: Is the market correctly bracing for forecast earnings declines, or is the SWS DCF model capturing cash generation that short term sentiment is missing?
Look into how the SWS DCF model arrives at its fair value.
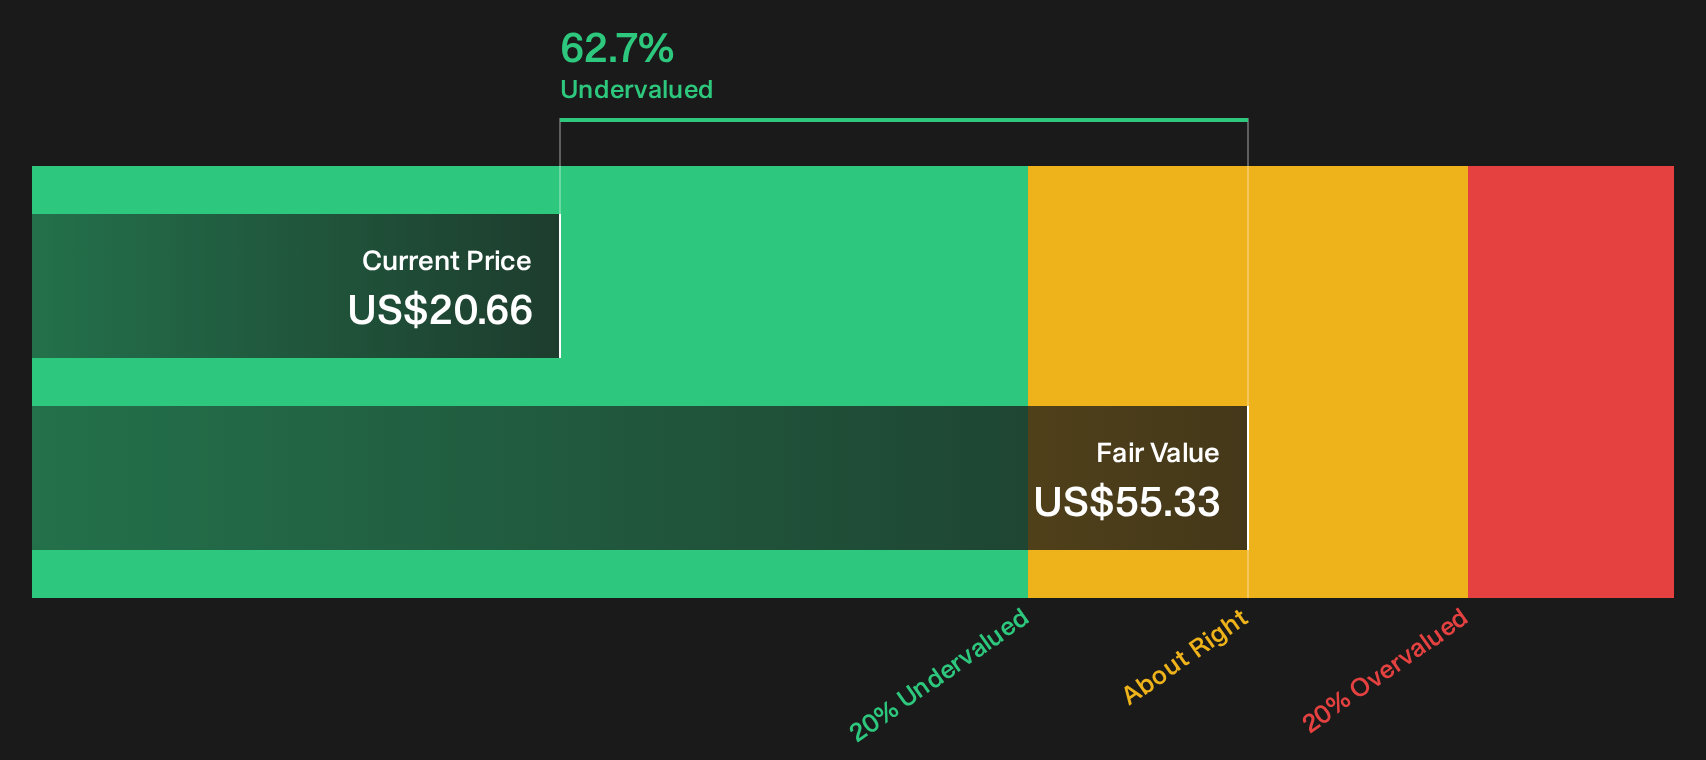
Simply Wall St performs a discounted cash flow (DCF) on every stock in the world every day (check out Innoviva for example). We show the entire calculation in full. You can track the result in your watchlist or portfolio and be alerted when this changes, or use our stock screener to discover 32 high quality undervalued stocks. If you save a screener we even alert you when new companies match - so you never miss a potential opportunity.
Next Steps
Mixed signals on Innoviva can either be a warning light or an opportunity depending on how you read the data, so move quickly, dig into both sides of the story and weigh the 3 key rewards and 2 important warning signs.
Looking for more investment ideas beyond Innoviva?
If Innoviva has your attention, do not stop there. Fresh ideas often come from scanning the wider market before the crowd catches on.
- Spot potential mispricing early by scanning companies that line up on valuation and quality using the 32 high quality undervalued stocks.
- Prioritize resilience and sleep easier at night by filtering for businesses that clear strict balance sheet checks with the 11 resilient stocks with low risk scores.
- Get ahead of the market by reviewing a focused 15 high quality undiscovered gems that aims to surface quality that is still off most investors' radar.
This article by Simply Wall St is general in nature. We provide commentary based on historical data and analyst forecasts only using an unbiased methodology and our articles are not intended to be financial advice. It does not constitute a recommendation to buy or sell any stock, and does not take account of your objectives, or your financial situation. We aim to bring you long-term focused analysis driven by fundamental data. Note that our analysis may not factor in the latest price-sensitive company announcements or qualitative material. Simply Wall St has no position in any stocks mentioned.
Have feedback on this article? Concerned about the content? Get in touch with us directly. Alternatively, email editorial-team@simplywallst.com