
- PRICING
- LIVE QUOTES
- LEARN
- HELP


EN
Why YONEX (TSE:7906) Is Back In The Spotlight
YONEX (TSE:7906) came back into focus after recent trading left the share price at ¥2,385. The stock has declined over the past month but is modestly higher across the past 3 months.
For YONEX, the recent slide, including a 7-day share price return of down 7.05% and a 30-day move of down 15.55%, sits against a 1-year total shareholder return of down 40.24% but still a 5-year total shareholder return of 201.51%. This indicates that shorter term momentum has faded, while long term holders have seen substantial gains.
Scan beyond YONEX's recent pullback and line up other consumer-focused stocks with resilient numbers using the curated list of solid balance sheet and fundamentals (19 results)
After a sharp pullback yet still strong 5 year gains, YONEX now asks a simple question: Do current valuations fairly reflect that mix of pressure and progress, or tilt the risk reward toward new buyers?
Price-to-Earnings of 15.2x: Is it justified?
YONEX currently trades on a P/E of 15.2x, which the data flags as good value compared both to its own fair P/E level and to peers on the TSE.
The P/E ratio compares the share price to earnings per share and effectively shows how many years of current profit the market is willing to pay for. For a consumer durables manufacturer with positive earnings, forecast profit growth and a long operating history, this is a widely used reference point.
For YONEX, the current 15.2x P/E sits slightly below an estimated fair P/E of 15.7x and below a peer average of 15.7x. This points to investors pricing the business a touch more conservatively than both its fair ratio and comparable leisure stocks. In that context, the market is assigning a valuation level that screens as restrained rather than optimistic, even with earnings forecast to grow and revenue expected to rise faster than the broader JP market.
Stacking this against the wider JP Leisure industry, YONEX trades at the same 15.2x P/E as the sector average while still screening as good value versus both industry and direct peers. If the share price were to move toward the indicated fair ratio, that would imply the multiple could shift closer to the 15.7x level that regression analysis points to as justified based on fundamentals.
Explore the SWS fair ratio for YONEX
Result: Price-to-Earnings of 15.2x (UNDERVALUED)
Still, the sharp 1 year decline, ongoing 30 day weakness, and reliance on discretionary sports spending could quickly challenge the current YONEX valuation story.
Find out about the key risks to this YONEX narrative.
Another View on YONEX Using Our DCF Model
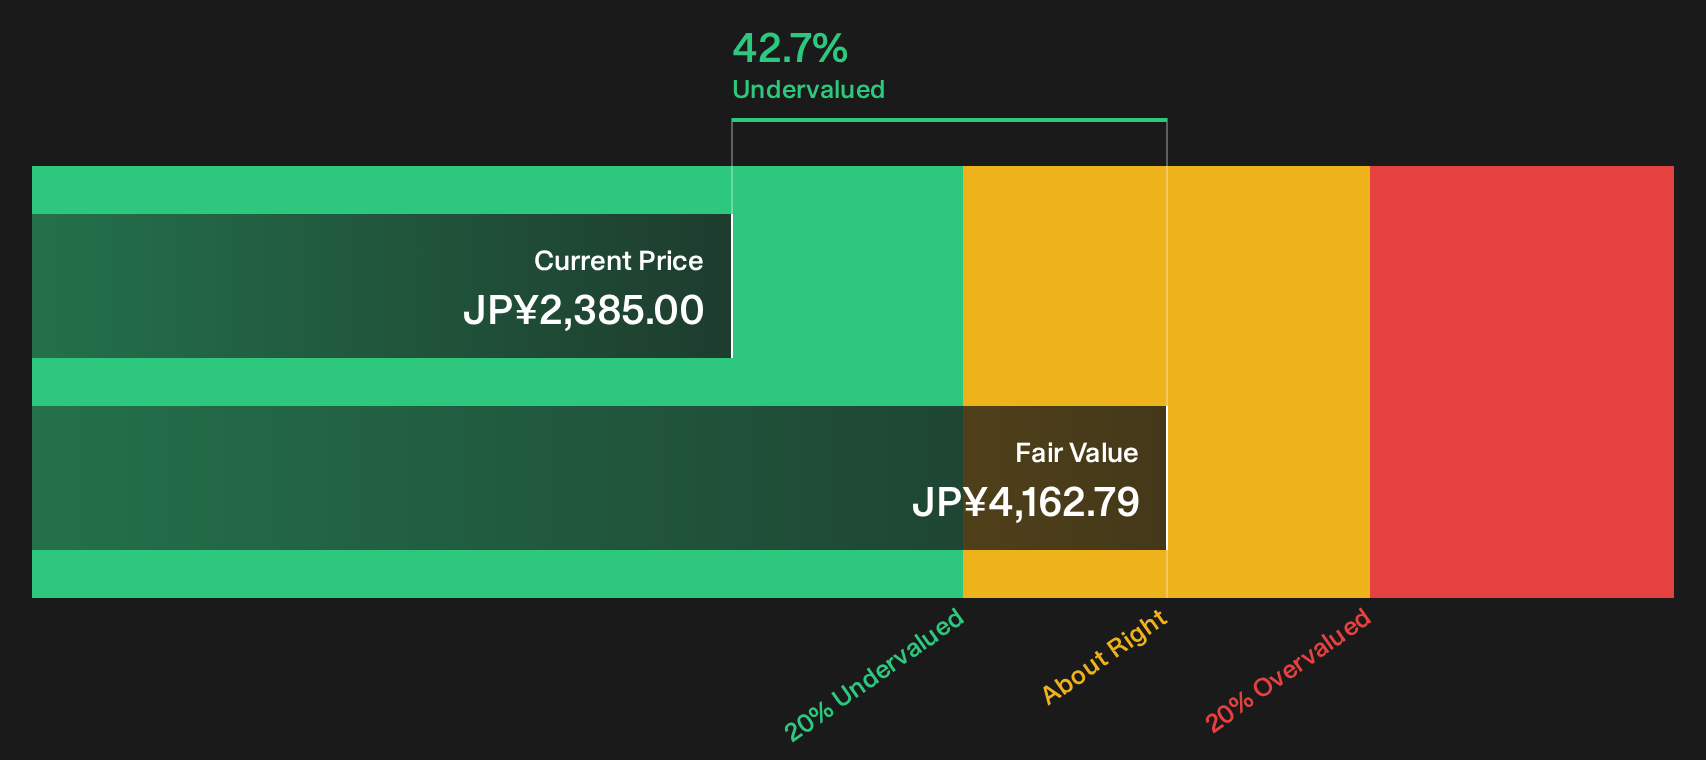
The P/E discussion presents YONEX as slightly restrained, but the SWS DCF model conveys a stronger message. At ¥2,385, the shares are compared with an estimated future cash flow value of ¥4,162.79, which, within that framework, indicates the stock as materially undervalued.
If one tool suggests an opportunity and another points to a wider gap, the key question becomes which set of assumptions you place the most weight on when your own money is at stake.
Look into how the SWS DCF model arrives at its fair value.
Simply Wall St performs a discounted cash flow (DCF) on every stock in the world every day (check out YONEX for example). We show the entire calculation in full. You can track the result in your watchlist or portfolio and be alerted when this changes, or use our stock screener to discover 17 high quality undervalued stocks. If you save a screener we even alert you when new companies match - so you never miss a potential opportunity.
Next Steps
Sentiment around YONEX in this piece has been mixed, so if you want a sharper view, move quickly and work through the numbers yourself. To see what the market-friendly positives look like in one place, take a closer look at the 4 key rewards
Looking for more investment ideas beyond YONEX?
Do not stop your research with YONEX. Broaden your watchlist now and give yourself more options before the next round of market moves catches you off guard.
- Target potential mispricing and scan for quality at a discount by checking the 17 high quality undervalued stocks.
- Build an income focused watchlist and review the 19 dividend fortresses for companies pairing yield with robust fundamentals.
- Lower portfolio stress by focusing on resilience and review the 10 resilient stocks with low risk scores while conditions are still shifting.
This article by Simply Wall St is general in nature. We provide commentary based on historical data and analyst forecasts only using an unbiased methodology and our articles are not intended to be financial advice. It does not constitute a recommendation to buy or sell any stock, and does not take account of your objectives, or your financial situation. We aim to bring you long-term focused analysis driven by fundamental data. Note that our analysis may not factor in the latest price-sensitive company announcements or qualitative material. Simply Wall St has no position in any stocks mentioned.
Have feedback on this article? Concerned about the content? Get in touch with us directly. Alternatively, email editorial-team@simplywallst.com