
- PRICING
- LIVE QUOTES
- LEARN
- HELP


EN
CPI FIM (BDL:ORCL) Reports Half Year 2026 Results, Is It Still A Bargain?
CPI FIM (BDL:ORCL) drew fresh attention after reporting half year 2026 results, with revenue of €56.29 million and net income of €143.83 million, highlighting a different earnings mix from the prior period.
CPI FIM’s latest figures landed against a weak price backdrop, with the share price down 29% year to date and the 1-year total shareholder return also lower by 29%. However, the 3-year total shareholder return is still up 69.05%, which hints that longer term momentum has cooled recently.
Compare CPI FIM’s recent pullback with other potential rebound candidates by scanning a curated 185 high quality undervalued stocks that pairs compressed prices with stronger fundamentals.
CPI FIM now trades with a wide gap between its €0.71 share price and some implied valuation estimates from intrinsic metrics. So where does fair value actually line up after this sharp pullback and shifting earnings mix?
Price-to-Earnings of 5.1x: Is it justified?
CPI FIM trades on a P/E of 5.1x, which looks low against both peers and the recent share price of €0.71 that has retreated sharply.
The P/E ratio compares the current share price with earnings per share and gives a shorthand view of how much investors pay for each euro of profit. For a real estate investment business focused on income generating assets, this metric helps you see how the market values recurring earnings tied to rents and property operations.
Here, the 5.1x P/E is well below the peer average of 20.8x and also below the wider European real estate P/E of 11.9x. The gap suggests the market is attaching a much lower earnings multiple to CPI FIM than to comparable property stocks, even after a year in which earnings growth of 98.6% outpaced the sector and profit margins are higher than last year. That leaves investors weighing whether the discount reflects concerns around factors like debt coverage, earnings quality affected by one off items, or future performance, or whether sentiment has simply pushed the valuation too far down.
On a pure comparison basis, a 5.1x multiple against 20.8x peers and 11.9x for the broader European real estate group is a steep step down. The market is pricing CPI FIM’s earnings at a sizeable discount to sector averages, and any shift in confidence around the durability of profits or balance sheet strength could change how that gap is viewed.
See what the numbers say about this price — find out in our valuation breakdown.
Result: Price-to-Earnings of 5.1x (UNDERVALUED)
Still, CPI FIM carries clear risks if rental income weakens in key markets or if debt service costs erode the support provided by its low P/E ratio.
Find out about the key risks to this CPI FIM narrative.
Another View on CPI FIM’s Value
The low 5.1x P/E hints at a cheap CPI FIM, yet the SWS DCF model presents an even starker picture. On that cash flow view, the shares at €0.71 sit well below an estimated future cash flow value of €2.95, which indicates a very wide valuation gap that investors need to interpret carefully.
Our DCF model uses a different lens to the earnings multiple and can be particularly sensitive to long term cash flow and discount rate assumptions that may or may not play out as expected. The contrast between a low P/E and a deep DCF discount raises a simple question: is the market correctly pricing risk or leaning too far into pessimism?
Look into how the SWS DCF model arrives at its fair value.
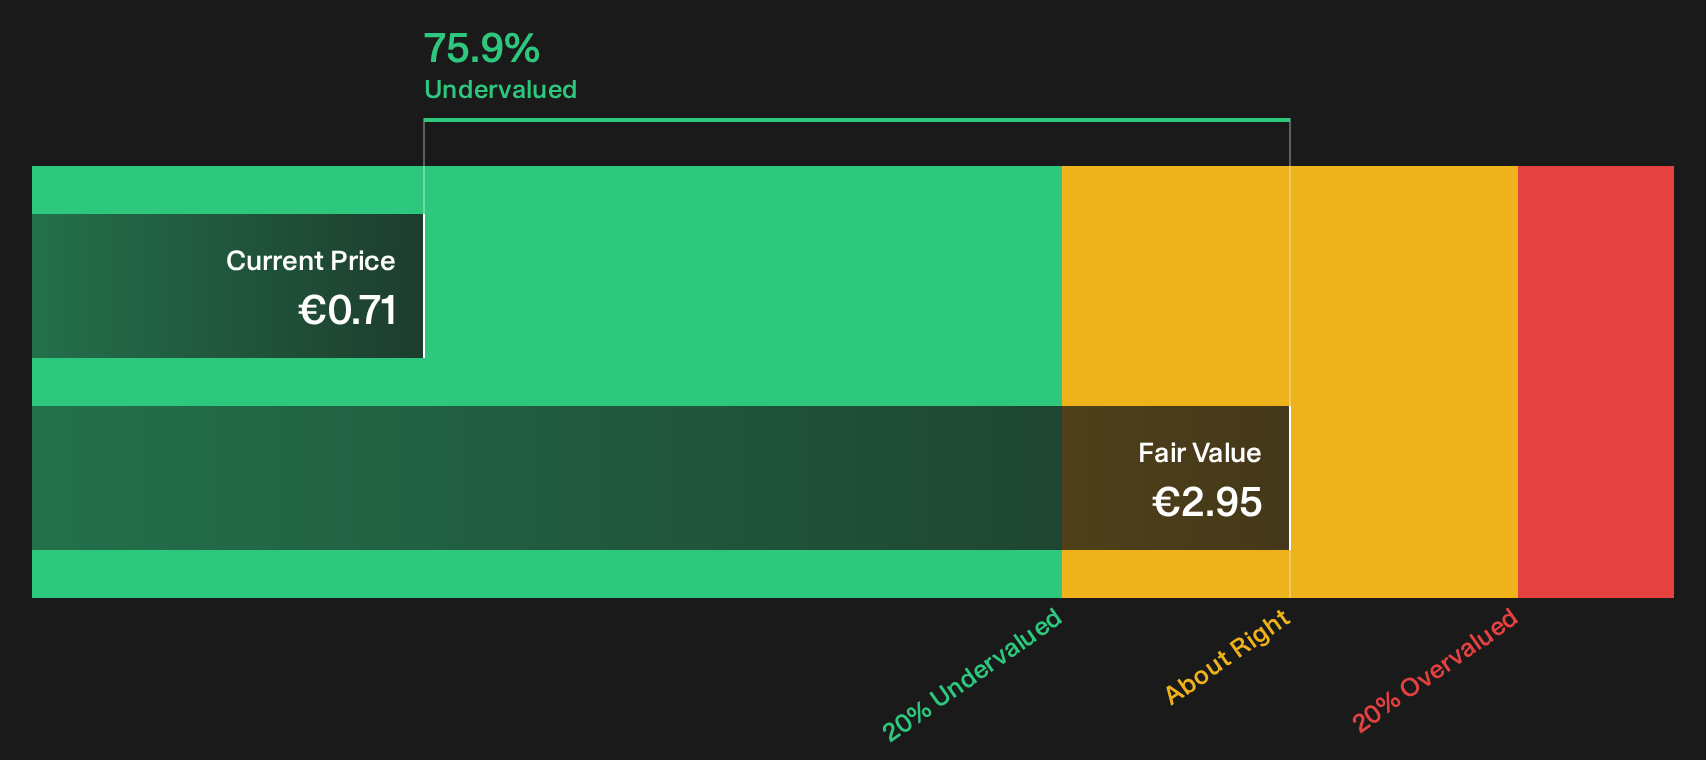
Simply Wall St performs a discounted cash flow (DCF) on every stock in the world every day (check out CPI FIM for example). We show the entire calculation in full. You can track the result in your watchlist or portfolio and be alerted when this changes, or use our stock screener to discover 185 high quality undervalued stocks. If you save a screener we even alert you when new companies match - so you never miss a potential opportunity.
Next Steps
Mixed signals around CPI FIM’s valuation and earnings can feel confusing, so move quickly, interrogate the numbers yourself, and then weigh the 2 key rewards and 4 important warning signs.
Looking for more CPI FIM sized investment ideas?
If CPI FIM has your attention, do not stop at a single opportunity. Use targeted screeners to surface other stocks that fit the kind of profile you want.
- Target compressed valuations and hunt for potential mispricings by scanning a curated pool of 185 high quality undervalued stocks that share solid fundamentals with beaten down prices.
- Strengthen your defensive side by reviewing a 98 resilient stocks with low risk scores that focuses on businesses with more resilient profiles when conditions get choppy.
- Go hunting for future leaders by checking a 620 high quality undiscovered gems that highlights quality companies still off most investors’ radar.
This article by Simply Wall St is general in nature. We provide commentary based on historical data and analyst forecasts only using an unbiased methodology and our articles are not intended to be financial advice. It does not constitute a recommendation to buy or sell any stock, and does not take account of your objectives, or your financial situation. We aim to bring you long-term focused analysis driven by fundamental data. Note that our analysis may not factor in the latest price-sensitive company announcements or qualitative material. Simply Wall St has no position in any stocks mentioned.
Have feedback on this article? Concerned about the content? Get in touch with us directly. Alternatively, email editorial-team@simplywallst.com