
- PRICING
- LIVE QUOTES
- LEARN
- HELP


EN
DTE Energy (DTE) Stock Looks Fairly Valued On Its 36% Run
DTE Energy stock has delivered a 36.4% gain over the past three years, yet the valuation picture is not entirely straightforward. The Dividend Discount Model (DDM) points to an intrinsic value above the current share price, while broader checks are less generous.
- Around 36.4% total return over three years suggests DTE Energy has already rewarded patient shareholders, so fresh buyers may need to consider carefully what potential remains.
- Reliable dividend cash flows can support the DDM estimate, while any pressure on future payout capacity or balance sheet flexibility may limit how much upside the market is willing to price in.
- The broader valuation score, with DTE Energy scoring 2 out of 6, points to a stock that appears more expensive than a clear bargain on most checks.
The key question now is whether the current US$132.58 share price already reflects the value of DTE Energy's dividend stream or still leaves a reasonable margin between market price and intrinsic value.
Scan beyond DTE Energy and compare its setup with hand-picked utilities and infrastructure plays using the 39 power grid technology and infrastructure stocks as a starting shortlist.
Does DTE Energy Look Undervalued on Dividends?
The Dividend Discount Model values DTE Energy by projecting its future dividend stream and then discounting those payouts back to today. For a mature utility business that leans on regular distributions, this kind of approach puts the focus squarely on dividend capacity and how fast those payments might grow.
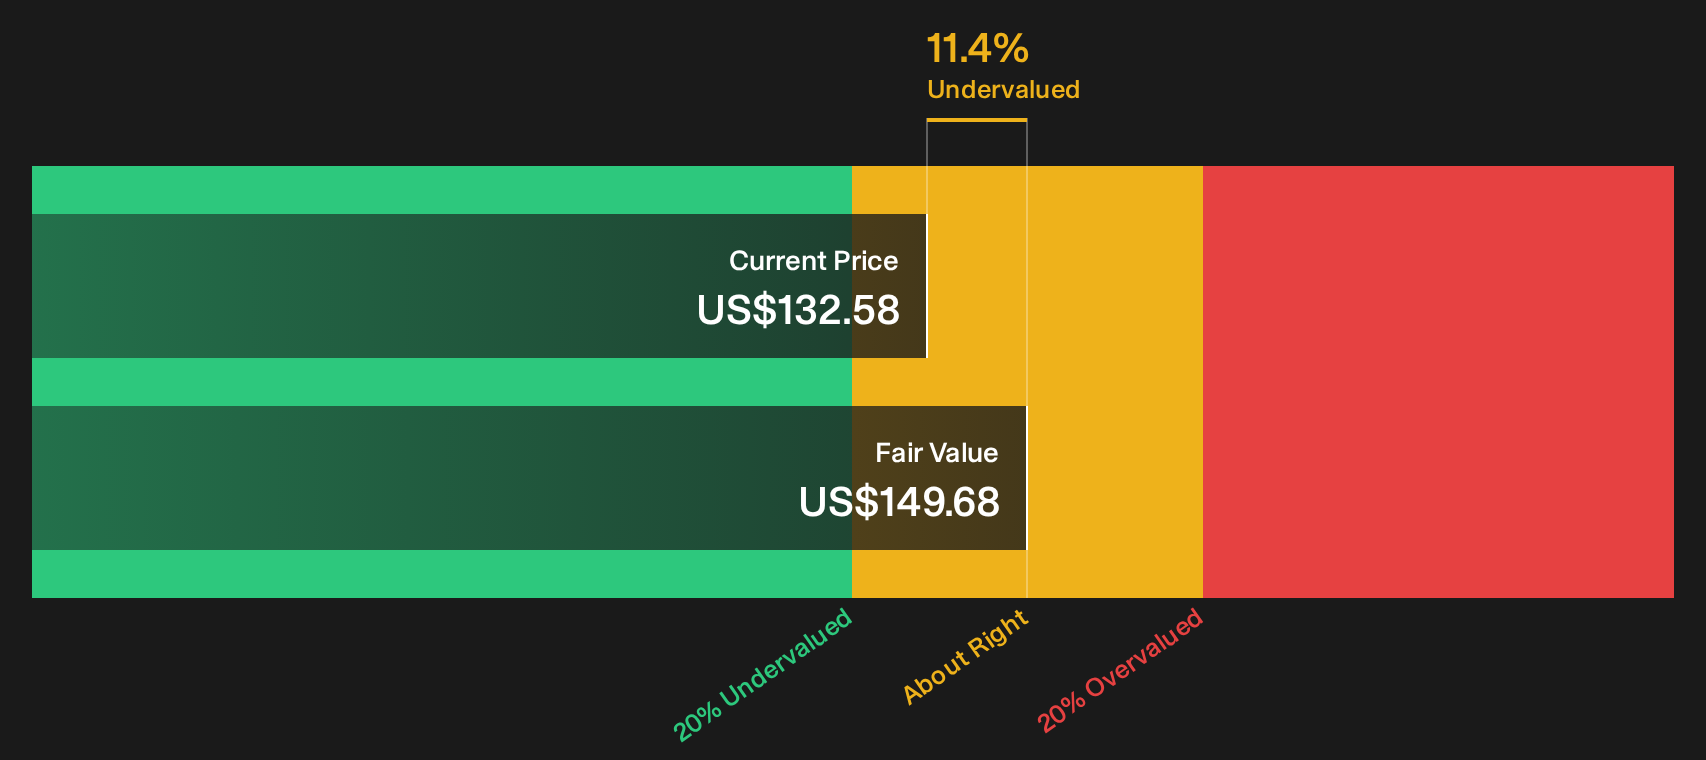
For DTE Energy, the model uses a current dividend per share of about $5.29, a return on equity of 12.53% and a payout ratio near 58%. Growth in dividends is capped at 3.7%, which sits below the model’s raw 5.23% input and reflects a more cautious long run assumption. That mix produces an estimated intrinsic value of about $149.68 per share, compared with the current $132.58 price. This implies the stock trades at an 11.4% discount to the DDM estimate.
On these dividend assumptions, DTE Energy stock screens as undervalued relative to the Dividend Discount Model estimate.
Our Dividend Discount Model (DDM) analysis suggests DTE Energy is undervalued by 11.4%. Track this in your watchlist or portfolio, or discover 31 more high quality undervalued stocks.
Where Does DTE Energy Sit on Earnings?
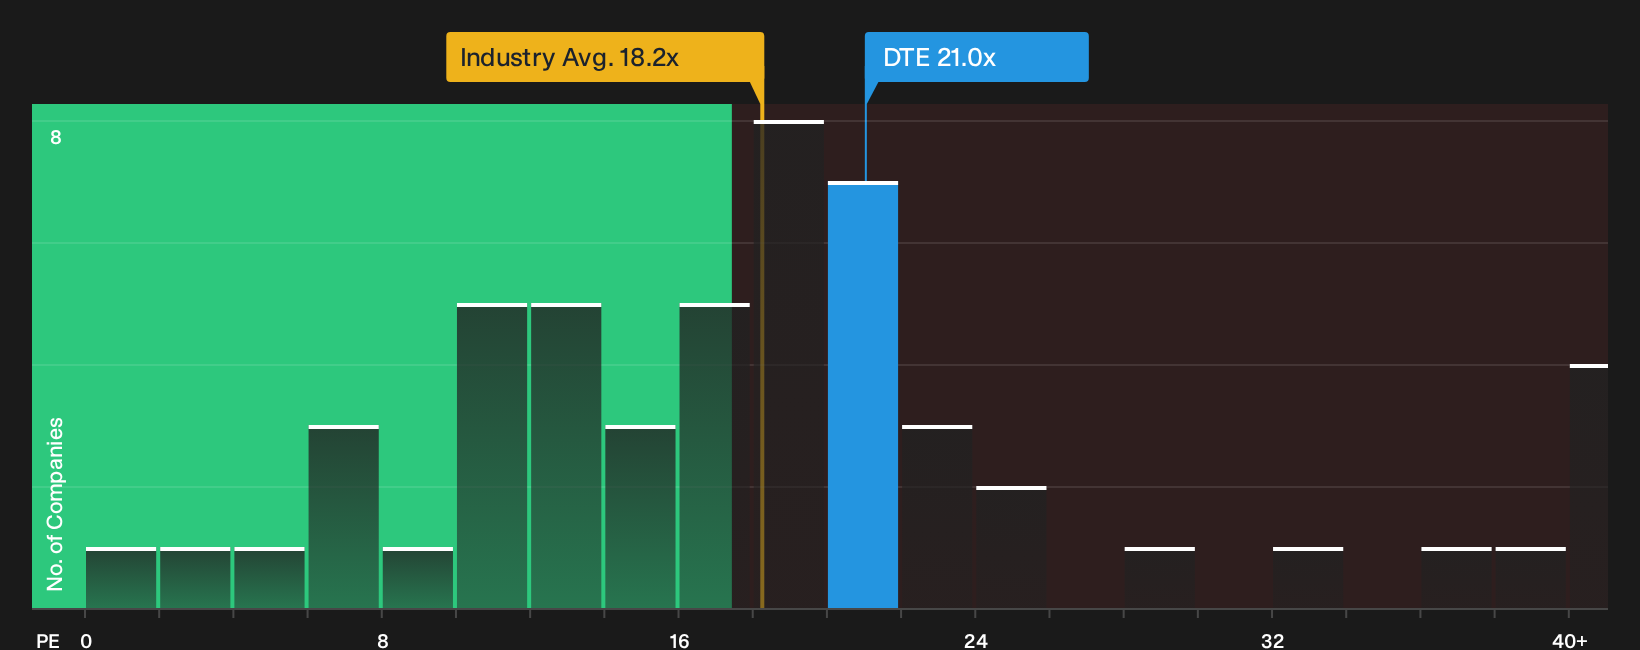
DTE Energy lends itself well to a P/E check because earnings are a key anchor for a regulated utility with steady profitability targets. On this yardstick, the stock trades on about 21.0x earnings, slightly above the Integrated Utilities industry average of roughly 18.2x and also ahead of the peer group on about 20.0x. That puts the share price on a modest premium to many similar utility stocks rather than at outright bargain levels.
The Fair P/E Ratio for DTE Energy, which blends its sector, profitability profile and risk factors, comes out at about 22.6x. Compared with the current 21.0x multiple, that model only points to a small gap that does not clearly argue for a deep discount or an extreme premium. For investors cross checking the dividend valuation work, this earnings multiple suggests the stock is priced in a middle zone.
On the P/E yardstick, DTE Energy looks roughly fairly valued relative to what the model implies for its earnings profile.
See what the numbers say about this price — find out in our valuation breakdown.
The DTE Energy Narrative: What Would Justify Today's Price?
DTE Energy's valuation puzzle only really comes into focus once you spell out the future paths that could justify a much higher or much lower price than today. Simply Wall St Narratives on the Community page do that by tying each scenario to a clear view on where DTE Energy's growth profile, profitability and key risks might head next, so you can revisit those assumptions as fresh information arrives.
Share a narrative on DTE Energy's valuation story and present a clear, number-driven case describing where its growth, margins and execution go from here.
By adding your view, you become one of the first voices in the Simply Wall St community to track how that thesis holds up as new data is released.
Do you think there's more to the story for DTE Energy? Head over to our Community to see what others are saying!
The Bottom Line
DTE Energy looks modestly undervalued on the Dividend Discount Model (DDM), while the P/E work suggests the share price is roughly in line with similar utilities. That tension reflects a gap between what dividend-focused cash flow assumes and what the market is willing to pay based on peer comparisons and sentiment. Broader checks remain cautious, so the key question is whether DTE Energy can sustain its dividend profile without stretching the balance sheet. The crux for investors is whether that discount to intrinsic value signals mispricing or simply compensates for the risk that future payouts grow more slowly than hoped.
This article by Simply Wall St is general in nature. We provide commentary based on historical data and analyst forecasts only using an unbiased methodology and our articles are not intended to be financial advice. It does not constitute a recommendation to buy or sell any stock, and does not take account of your objectives, or your financial situation. We aim to bring you long-term focused analysis driven by fundamental data. Note that our analysis may not factor in the latest price-sensitive company announcements or qualitative material. Simply Wall St has no position in any stocks mentioned.
Have feedback on this article? Concerned about the content? Get in touch with us directly. Alternatively, email editorial-team@simplywallst.com