
- PRICING
- LIVE QUOTES
- LEARN
- HELP


EN
Imperial Metals (TSX:III) Faces Mount Polley Setbacks As Valuation Questions Grow
Imperial Metals: operational setbacks behind the latest share move
Imperial Metals (TSX:III) has come under pressure after weaker recent production and profitability, with lower grades, recoveries, and throughput at Mount Polley weighing on consolidated copper and gold output and investor sentiment.
The recent pullback has come after a strong run. The share price is up 31.2% over the past 90 days and the 1-year total shareholder return is 76.44%. However, the year-to-date share price return is down 7.44%, which suggests momentum has cooled as investors reassess Imperial Metals around its CA$9.21 level.
Compare Imperial Metals' recent pullback with curated peers by scanning the 29 top copper producer stocks that may be better placed for the next move in copper and gold exposure.
Imperial Metals now sits between two stories. Recent weakness can mirror tougher operations at Mount Polley or simply cooler sentiment after a strong run. Valuation analysis will help indicate which factor is more significant.
Imperial Metals valuation check: is the current P/E doing too much heavy lifting?
Imperial Metals trades on a P/E of 15.2x at a share price of CA$9.21, which lines up below the broader Canadian market but above its direct peer group. The question is whether that earnings multiple is pulling more weight than the underlying performance justifies.
The P/E ratio compares what investors are paying today for each dollar of current earnings. For a copper and gold producer like Imperial Metals, this metric often reflects how confident the market feels about future profitability, mine life, and cost control, since cash flows can swing sharply with grades, recoveries, and commodity prices.
On the numbers provided, Imperial Metals has a P/E of 15.2x. That is lower than the Canadian market average of 16.9x, which suggests the stock is not priced at a premium to the market overall. Yet it trades on a richer multiple than its direct peer average of 13.4x, and earnings over the past year have fallen 38.8% with profit margins compressing from 28.1% to 16.4%. That mix points to investors giving the business some benefit of the doubt despite weaker recent profitability.
Compared to the Canadian Metals and Mining industry average P/E of 16.9x, the Imperial Metals valuation sits slightly lower, indicating the market is not paying a full industry premium for its earnings. At the same time, the SWS DCF model estimates a future cash flow value of CA$6.82 per share versus the current CA$9.21 level, which implies the market price is already baking in stronger cash generation than that model suggests.
See what the numbers say about this price, find out in our valuation breakdown See what the numbers say about this price — find out in our valuation breakdown.
Result: Price-to-Earnings of 15.2x (OVERVALUED)
Still, the reliance on Mount Polley and Red Chris for most of Imperial Metals revenue, along with weaker recent margins, could quickly challenge the current earnings multiple.
Find out about the key risks to this Imperial Metals narrative.
Another view on Imperial Metals valuation
The P/E paints one picture for Imperial Metals, yet the SWS DCF model sketches another. On those cash flow estimates, fair value sits at CA$6.82 per share against the current CA$9.21 price, which points to an overvalued stock on this method. Which lens do you trust more when earnings and mine performance can swing so sharply?
If that gap between price and cash flow assumptions matters to your process, it is worth looking at how the SWS DCF model is built and what would need to change for Imperial Metals to close that gap Look into how the SWS DCF model arrives at its fair value.
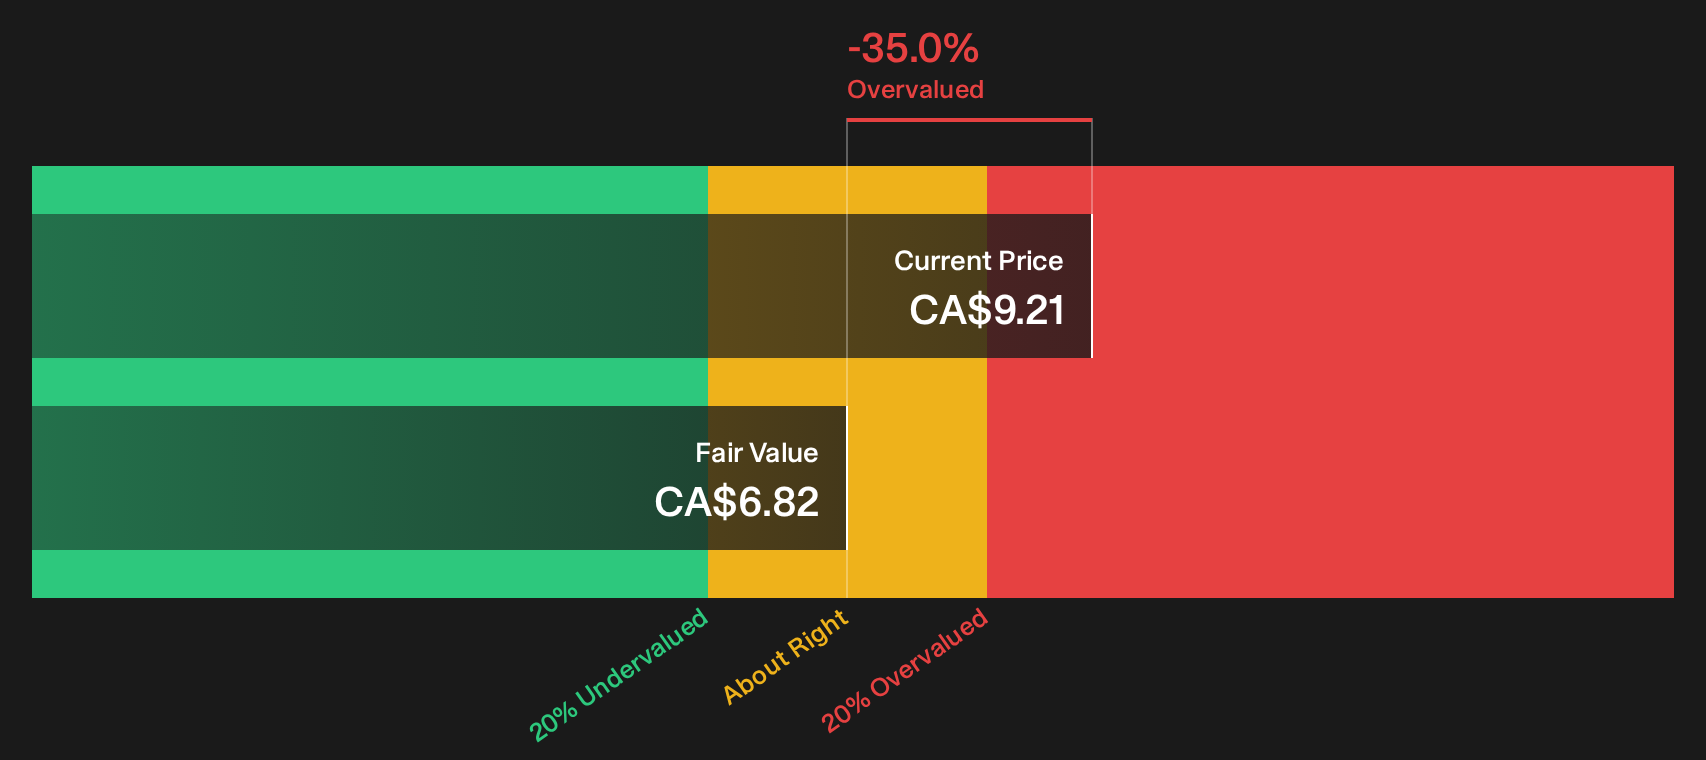
Simply Wall St performs a discounted cash flow (DCF) on every stock in the world every day (check out Imperial Metals for example). We show the entire calculation in full. You can track the result in your watchlist or portfolio and be alerted when this changes, or use our stock screener to discover 5 high quality undervalued stocks. If you save a screener we even alert you when new companies match - so you never miss a potential opportunity.
Next Steps
If the mixed message on Imperial Metals has you on the fence, consider reviewing the data while it is current and pressure test the thesis for yourself by weighing its 1 key reward and 1 important warning sign
Looking for more investment ideas beyond Imperial Metals?
If Imperial Metals leaves you undecided, do not stop there. Use this moment to widen your watchlist before the next round of opportunities moves without you.
- Target resilient balance sheets by scanning a carefully filtered list of solid balance sheet and fundamentals (7 results) that can help you focus on companies with stronger financial foundations.
- Hunt for mispriced quality using a curated 5 high quality undervalued stocks that highlights businesses where fundamentals and market prices may be out of sync.
- Spot overlooked opportunities through a focused 9 high quality undiscovered gems that surfaces high quality companies still off most investors' radar.
This article by Simply Wall St is general in nature. We provide commentary based on historical data and analyst forecasts only using an unbiased methodology and our articles are not intended to be financial advice. It does not constitute a recommendation to buy or sell any stock, and does not take account of your objectives, or your financial situation. We aim to bring you long-term focused analysis driven by fundamental data. Note that our analysis may not factor in the latest price-sensitive company announcements or qualitative material. Simply Wall St has no position in any stocks mentioned.
Have feedback on this article? Concerned about the content? Get in touch with us directly. Alternatively, email editorial-team@simplywallst.com