
- PRICING
- LIVE QUOTES
- LEARN
- HELP


EN
Why SK hynix (NasdaqGS:SKHY) Is Back In The Spotlight
SK hynix (NasdaqGS:SKHY) is back in focus after South Korea’s KOSPI index saw sharp swings this year, with chip heavyweights like SK hynix cited as key drivers of that volatility.
Recent moves in SK hynix share price tell a different story from the choppy KOSPI. The stock posted a 1-day share price return of 0.94%, a 7-day share price return of 7.38%, and a punchy 30-day share price return of 23.09%. A 13.13% year to date share price return suggests momentum has been building as investors react to tighter supply contracts across the memory sector and renewed attention on how leveraged chip ETFs feed into broader market swings.
Scan the wider chip universe for other SK hynix style momentum plays in semiconductors using our curated list of 89 AI infrastructure stocks.
After that surge, SK hynix still trades at a steep discount to both its quoted fair value estimates and analyst targets. Is the gap a sign of excessive caution, or is the market flagging real risks?
Price-to-Earnings of 8.2x: Is it justified?
At roughly $190 per share, SK hynix changes hands at a P/E of 8.2x, which points to a valuation well below both peers and the wider US semiconductor group.
The P/E ratio compares what investors pay per share to the earnings that SK hynix generates per share. For chip makers, this yardstick often reflects how confident the market is in the durability of profits through future memory and logic cycles.
SK hynix has very large trailing earnings growth, with reported profit expanding far faster than both its own 5 year average and the broader semiconductor industry. Forecasts in the data provided also point to quicker earnings and revenue expansion than the wider US market. An 8.2x multiple in that context suggests investors are pricing in a sizeable margin of safety on those profits rather than paying up for growth.
Compared with the US semiconductor industry average P/E of 46.4x and a peer group average of 56.1x, SK hynix trades at a deep discount. The gap is wide enough that any reassessment of its earnings quality, cash flow conversion, or cycle sensitivity could have a meaningful impact on where that multiple settles over time.
See what the numbers say about this price — find out in our valuation breakdown.
Result: Price-to-Earnings of 8.2x (UNDERVALUED)
Still, the SK hynix story carries risks if memory pricing weakens or if demand from key markets like the US and China cools more than expected.
Find out about the key risks to this SK hynix narrative.
Another view on SK hynix valuation
The SWS DCF model takes a different angle on SK hynix. On that framework, the shares at $190.07 trade around 67% below an estimated future cash flow value of $576.01, which also screens as undervalued. If both earnings multiples and cash flows point lower, an important question is where the real anchor might be for this stock.
Look into how the SWS DCF model arrives at its fair value.
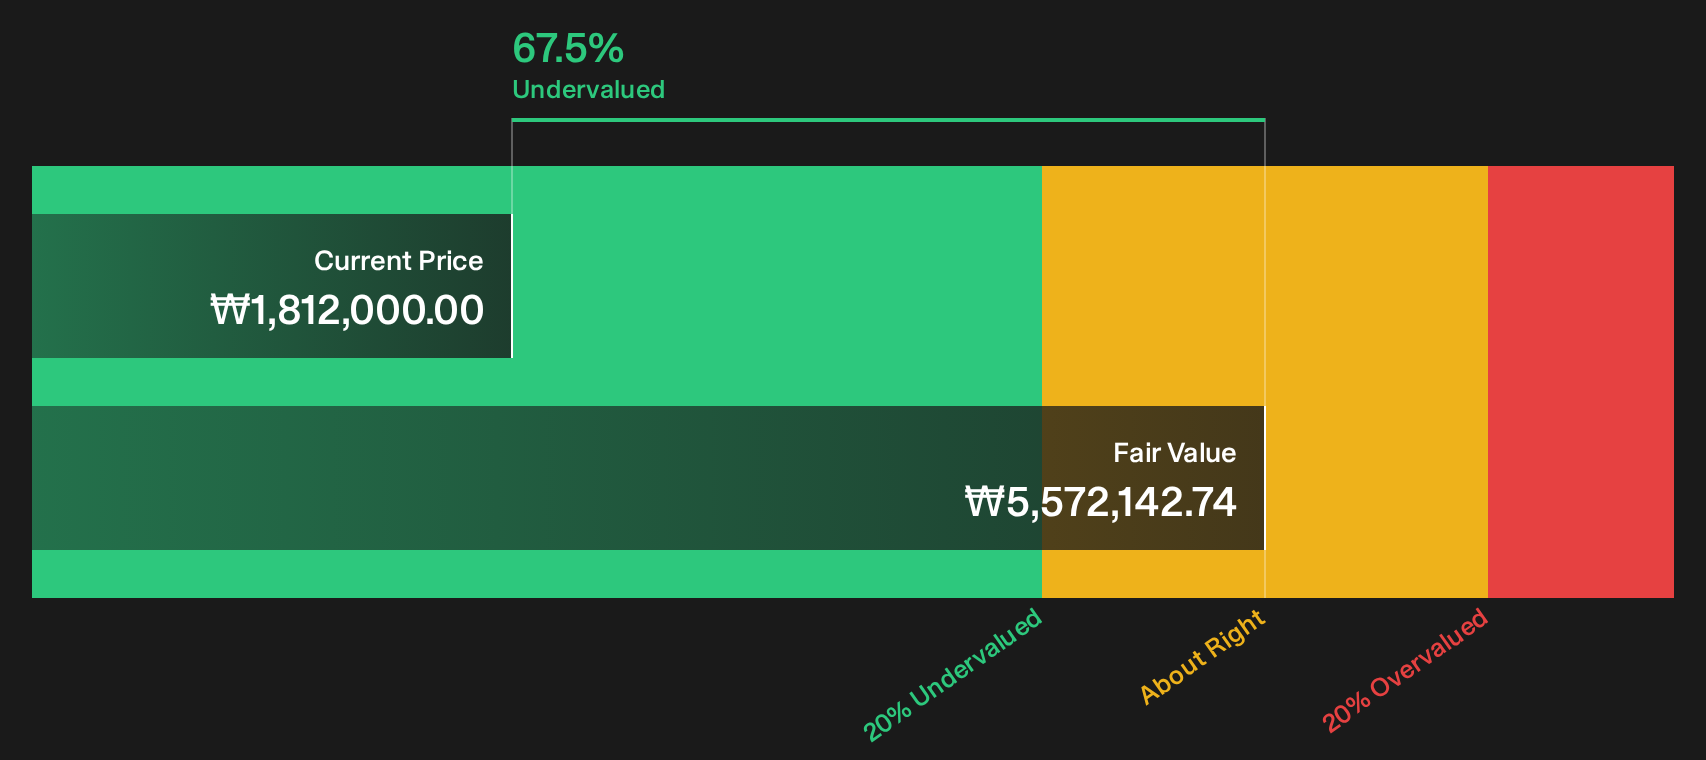
Simply Wall St performs a discounted cash flow (DCF) on every stock in the world every day (check out SK hynix for example). We show the entire calculation in full. You can track the result in your watchlist or portfolio and be alerted when this changes, or use our stock screener to discover 31 high quality undervalued stocks. If you save a screener we even alert you when new companies match - so you never miss a potential opportunity.
Next Steps
With SK hynix sending mixed valuation signals, sentiment can shift quickly. It is important to act promptly, review the underlying metrics, and weigh both the potential upside and the areas of caution by checking the 3 key rewards and 2 important warning signs.
Hunt for more SK hynix style opportunities
Do not stop with SK hynix. Use the Simply Wall Street Screener to line up clear, data driven ideas before the next wave of pricing shifts hits.
- Target quality at a discount by scanning a curated pool of companies that look cheap against their fundamentals using the 31 high quality undervalued stocks.
- Build a steadier income stream by focusing on businesses with strong payouts and reliable metrics through the 6 dividend fortresses.
- Prioritise resilience by filtering for companies with robust finances and low risk profiles using the 11 resilient stocks with low risk scores.
This article by Simply Wall St is general in nature. We provide commentary based on historical data and analyst forecasts only using an unbiased methodology and our articles are not intended to be financial advice. It does not constitute a recommendation to buy or sell any stock, and does not take account of your objectives, or your financial situation. We aim to bring you long-term focused analysis driven by fundamental data. Note that our analysis may not factor in the latest price-sensitive company announcements or qualitative material. Simply Wall St has no position in any stocks mentioned.
Have feedback on this article? Concerned about the content? Get in touch with us directly. Alternatively, email editorial-team@simplywallst.com