
- PRICING
- LIVE QUOTES
- LEARN
- HELP


EN
OSI Systems (OSIS) Could Be 28% Undervalued On Five Year Growth And Cash Flow Gains
Recent financial trends at OSI Systems (OSIS) triggered fresh attention from investors after consistent revenue and earnings growth over five years, paired with stronger free cash flow margins that increase the company’s financial flexibility.
OSI Systems shares closed at US$201.25 after a 1-day share price gain of 1.9%. However, the 30-day share price return is down 13.7% and the year-to-date share price return is down 21.3%, while the 3-year total shareholder return of 66.3% and 5-year total shareholder return of 116.8% show longer term holders have still seen strong compounding even as recent momentum has cooled.
Scan beyond OSI Systems and review a hand picked set of cash generative, high quality opportunities in our 33 high quality undervalued stocks.
OSI Systems now trades well below analyst targets after a sharp pullback. Is that discount pointing to mispricing, or is the market simply accounting for real risk as expectations reset?
Most Popular Narrative: 28.4% Undervalued
Against OSI Systems' last close at $201.25, the most followed narrative anchors on a fair value near $281, implying a sizeable valuation gap that hinges on specific growth drivers and contract visibility.
Record backlog levels, global customer diversification beyond large legacy contracts like Mexico, and increased investment in R&D for differentiated platforms position OSI to accelerate earnings and free cash flow growth, and to better capitalize on long-term secular trends underpinning security and diagnostic infrastructure spending.
Want to see what earnings path and profit profile this story is built on? The fair value rests on a mix of steady revenue expansion, firmer margins, and a future earnings multiple that needs to hold up. It is useful to understand which assumptions have the most impact on that $281 figure and how sensitive they are to execution. The full narrative lays out the numbers that make this pricing case work.
Result: Fair Value of $281.14 (UNDERVALUED)
Have a read of the narrative in full and understand what's behind the forecasts.
Still, the OSI Systems narrative can fray if delayed sovereign payments or prolonged weakness in the healthcare division squeeze cash generation and keep margins under pressure.
Find out about the key risks to this OSI Systems narrative.
Another View: OSI Systems Through A Cash Flow Lens
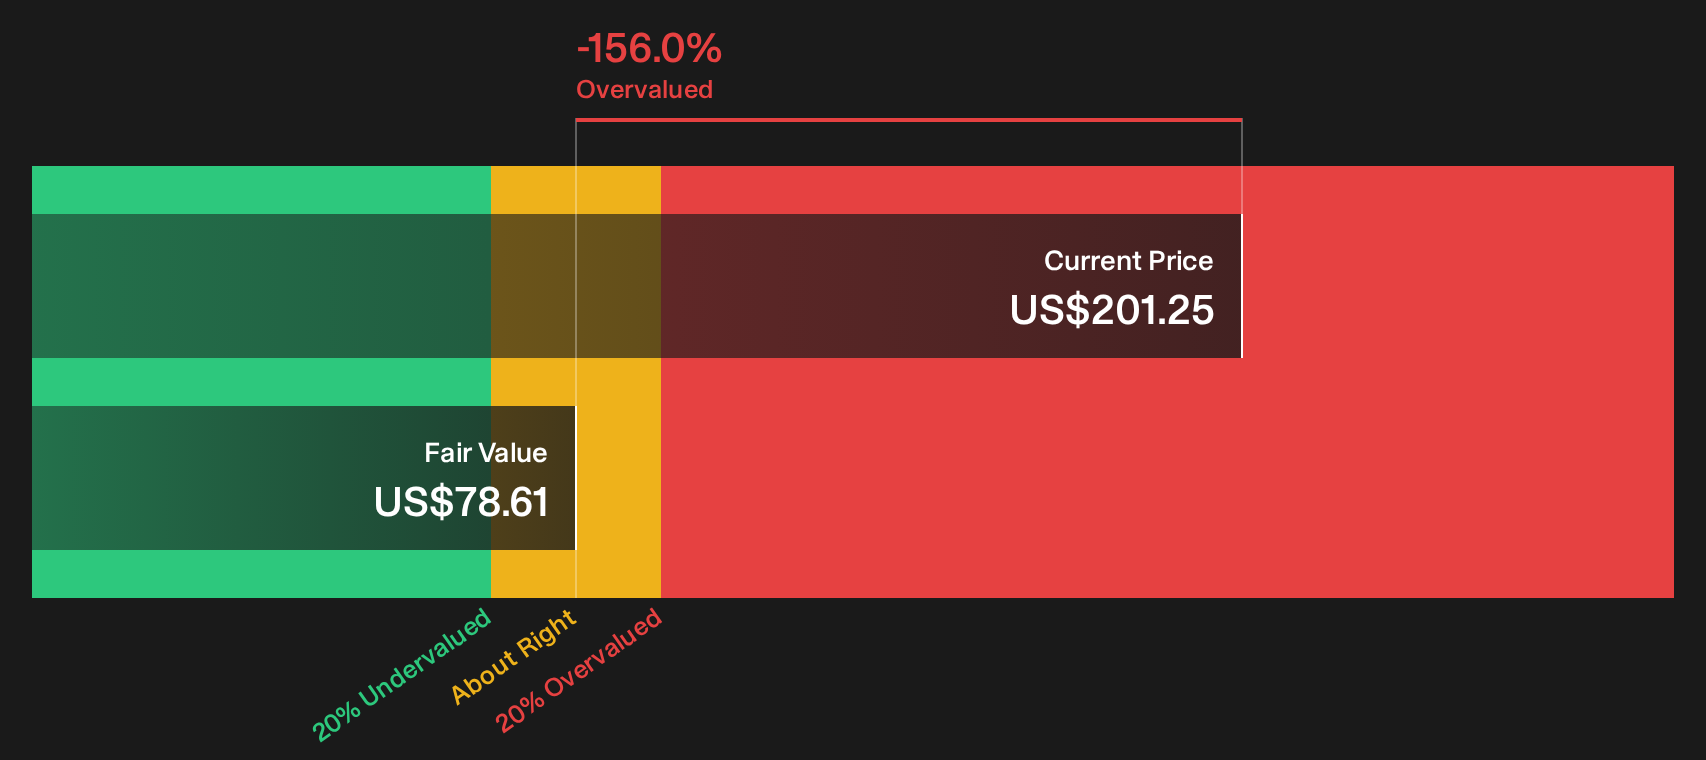
There is a clear split in how OSI Systems is being priced. While the popular fair value narrative centers on a $281 number based on earnings forecasts and multiples, the Simply Wall St DCF model points to a future cash flow value closer to $78.61 at the current $201.25 share price, which frames the stock as expensive on that basis. That kind of gap pushes you to ask which set of assumptions you trust more: the earnings path or the cash conversion profile.
Look into how the SWS DCF model arrives at its fair value.
Simply Wall St performs a discounted cash flow (DCF) on every stock in the world every day (check out OSI Systems for example). We show the entire calculation in full. You can track the result in your watchlist or portfolio and be alerted when this changes, or use our stock screener to discover 33 high quality undervalued stocks. If you save a screener we even alert you when new companies match - so you never miss a potential opportunity.
Next Steps
Mixed signals around OSI Systems can be confusing, so move quickly, look through the full data set yourself, and weigh both the potential upsides and the concerns by reviewing the 5 key rewards and 1 important warning sign.
Looking for more investment ideas beyond OSI Systems?
If OSI Systems has sharpened your focus on quality, do not stop here. Use the Simply Wall St screener to hunt for fresh opportunities that fit your plan.
- Target discounted potential by scanning a 33 high quality undervalued stocks that combine solid fundamentals with prices that sit below their assessed value.
- Strengthen portfolio resilience by reviewing a list of solid balance sheet and fundamentals (23 results) that can better handle shocks without stretching their finances.
- Spot opportunities off the beaten path by checking a 18 high quality undiscovered gems that the broader market may not be paying close attention to yet.
This article by Simply Wall St is general in nature. We provide commentary based on historical data and analyst forecasts only using an unbiased methodology and our articles are not intended to be financial advice. It does not constitute a recommendation to buy or sell any stock, and does not take account of your objectives, or your financial situation. We aim to bring you long-term focused analysis driven by fundamental data. Note that our analysis may not factor in the latest price-sensitive company announcements or qualitative material. Simply Wall St has no position in any stocks mentioned.
Have feedback on this article? Concerned about the content? Get in touch with us directly. Alternatively, email editorial-team@simplywallst.com