
- PRICING
- LIVE QUOTES
- LEARN
- HELP


EN
Is Edwards Lifesciences (EW) Above Fair Value Despite Fair Cash Flow?
Edwards Lifesciences stock has delivered a decline of about 28.8% over the past five years, yet current valuation checks now suggest the shares trade close to an intrinsic value estimate while traditional market multiples still look rich. That gap between a fairly valued Discounted Cash Flow (DCF) view and an overvalued read from market ratios is what investors have to weigh today.
- The 5 year return is down 28.8%, which means anyone who bought and held over that period has seen meaningful capital weakness despite more recent gains.
- Future cash flow expectations from the heart valve and critical care franchise can support the DCF assessment. However, any setback in procedure volumes or pricing could pressure those same cash flows and undermine the current market valuation.
- The broader checks rate Edwards Lifesciences as inexpensive on only 1 of 6 valuation measures, so the stock currently leans expensive rather than looking like a clear bargain.
The issue now is whether the present share price of Edwards Lifesciences already reflects its cash flow potential, or if there is still room for a more attractive entry point based on valuation alone.
Compare Edwards Lifesciences' mixed valuation signals with other high quality balance sheet stories by scanning solid balance sheet and fundamentals stocks screener (24 results) that analysts are watching for the next potential move.
Is Edwards Lifesciences Fairly Priced on Cash Flow?
The Discounted Cash Flow (DCF) model here focuses on what Edwards Lifesciences can generate in free cash over time rather than where the share price has moved recently.
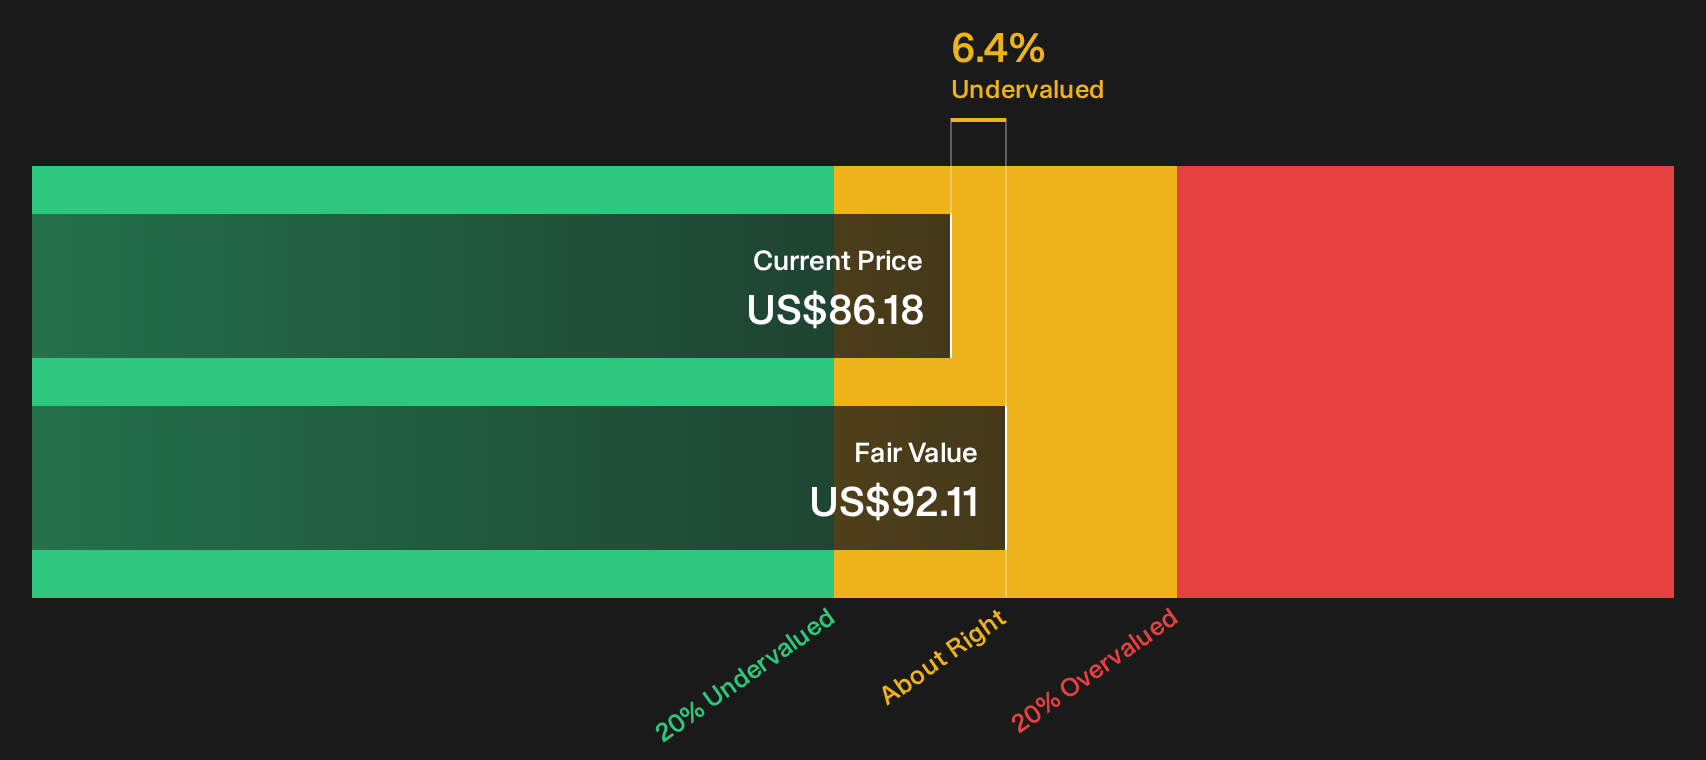
On the latest twelve month numbers, Edwards Lifesciences produced about $1.40b in free cash flow. The model then assumes those cash flows keep growing, with analyst inputs feeding into a 2 stage Free Cash Flow to Equity framework. Plugging those projections into the DCF gives an estimated intrinsic value of about $92.11 per share.
Set against the current market price, that output suggests the stock trades at roughly a 6.4% discount to the DCF estimate. For investors, the key takeaway is that a cash flow based lens presents Edwards Lifesciences as only modestly mispriced rather than sharply out of line with its underlying economics.
On this DCF view, Edwards Lifesciences stock appears roughly fairly valued with only a slight discount to intrinsic value.
Edwards Lifesciences is fairly valued according to our Discounted Cash Flow (DCF), but this can change at a moment's notice. Track the value in your watchlist or portfolio and be alerted on when to act.
Is Edwards Lifesciences Getting Expensive on Earnings?
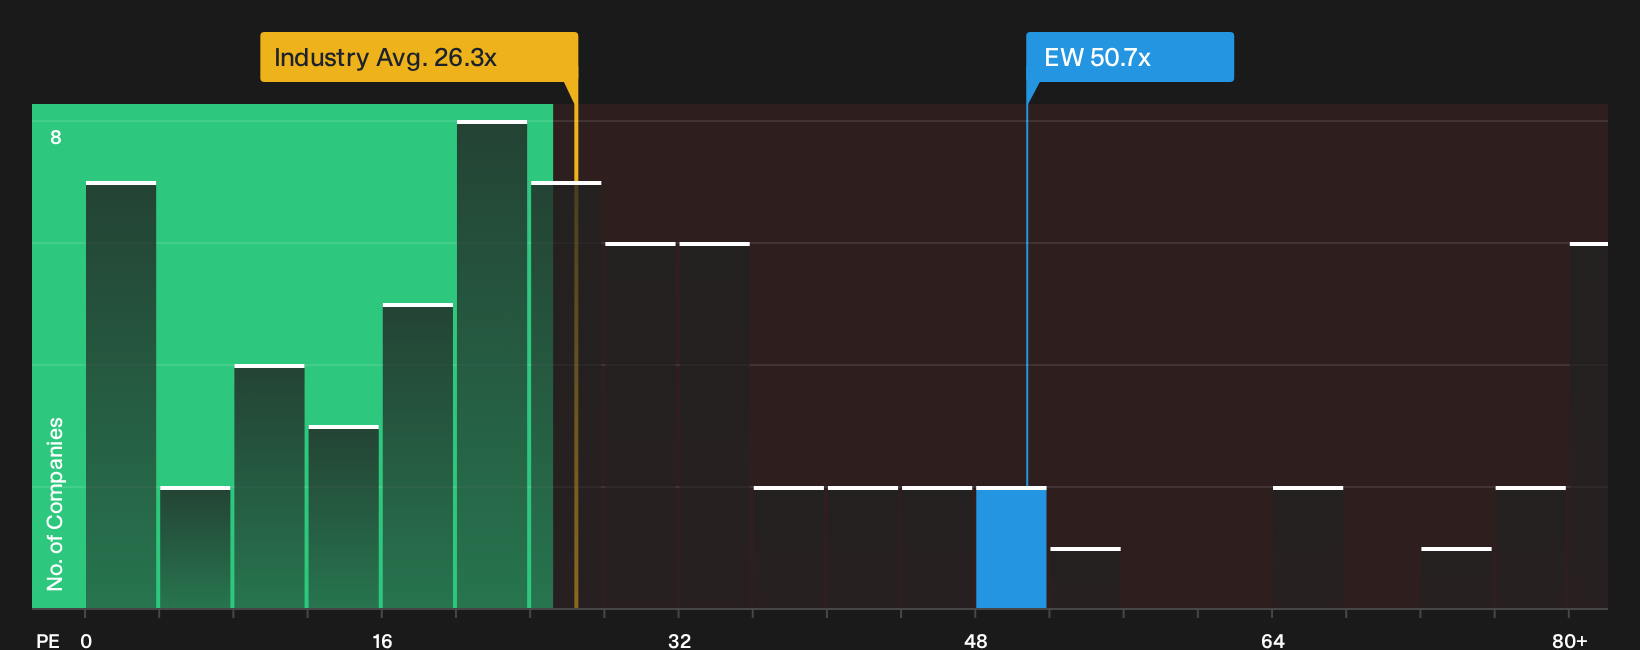
P/E is a useful lens for Edwards Lifesciences because earnings remain a key anchor for how the market prices profitable medical equipment businesses. On this measure, the stock trades on a P/E of around 50.7x. That level is almost double the Medical Equipment industry average of about 26.3x and also ahead of the peer group average of roughly 25.9x, so investors are paying a clear premium for each dollar of profit.
The fair P/E ratio implied by the broader checks sits closer to 34.7x. Compared with the current 50.7x, that is a wide gap and suggests the market is assigning a richer earnings multiple to Edwards Lifesciences than the model supports given its sector, size and risk profile. For anyone weighing the stock after the DCF work above, this earnings-based view points to a very different conclusion on price.
On the P/E yardstick, Edwards Lifesciences stock currently appears more expensive than both its estimated fair multiple and the wider medical equipment group.
See what the numbers say about this price — find out in our valuation breakdown.
The Edwards Lifesciences Narrative: What Would Justify Today's Price?
Simply Wall St Narratives pick up where this Edwards Lifesciences valuation puzzle leaves off. Narratives set out clear paths for how Edwards Lifesciences' revenue, margins and earnings might evolve so you can see what would need to happen for the stock to be worth materially more or less than today’s price, and each links its number to a specific view on future growth, profitability and risk that you can revisit as fresh information comes through on the Community page.
Share a narrative on Edwards Lifesciences' valuation trade off and be one of the first voices in the Simply Wall St community to lay out a clear, number driven case the whole group can track over time.
Do you think there's more to the story for Edwards Lifesciences? Head over to our Community to see what others are saying!
The Bottom Line
Edwards Lifesciences looks roughly aligned with its Discounted Cash Flow (DCF) intrinsic value estimate, with only a modest discount implied by that framework. The market multiples tell a different story, since the share price carries a premium P/E that screens as overvalued against peers and the fair multiple estimate. Those mixed signals, combined with a weak overall value score, suggest the key question is whether the quality of its heart valve and critical care cash flows can keep justifying a premium earnings multiple. For investors, the central issue is whether that premium remains in place or the P/E moves closer to sector norms over time.
This article by Simply Wall St is general in nature. We provide commentary based on historical data and analyst forecasts only using an unbiased methodology and our articles are not intended to be financial advice. It does not constitute a recommendation to buy or sell any stock, and does not take account of your objectives, or your financial situation. We aim to bring you long-term focused analysis driven by fundamental data. Note that our analysis may not factor in the latest price-sensitive company announcements or qualitative material. Simply Wall St has no position in any stocks mentioned.
Have feedback on this article? Concerned about the content? Get in touch with us directly. Alternatively, email editorial-team@simplywallst.com