
- PRICING
- LIVE QUOTES
- LEARN
- HELP


EN
Spadel (ENXTBR:SPA) Just Gave Investors A Bigger Question
Why Spadel’s latest half year report matters now
Spadel (ENXTBR:SPA) just released half year figures to June 30, 2026, with sales reported at €219.87 million and net income at €32.58 million, compared with €199.76 million and €26.78 million a year earlier.
Spadel’s latest half year report lands after an already strong run, with the share price up 52.54% year to date and a 1 year total shareholder return of 64.90% that builds on a 3 year total shareholder return of 124.38%.
Scan beyond Spadel and see which other quality consumer names are catching similar attention in our curated list of 617 high quality undiscovered gems.
Bulls see Spadel’s stronger half year figures and rapid share price rise as proof of quality, while bears worry the move already reflects the good news. Which side do the current valuation numbers back up?
Price-to-Earnings of 26.2x: Is it justified?
On the latest numbers, Spadel trades on a P/E of 26.2x at a share price of €360, which sits above the European Beverage sector average of 17.8x but below a peer group average of 47.7x.
The P/E ratio compares the current share price to earnings per share, so it shows how much investors are paying for each euro of Spadel’s profit. For a branded drinks producer, a higher multiple can reflect strong profitability, consistent demand for its products, or expectations that earnings will keep progressing from here.
Spadel’s recent history contains several ingredients that can help explain this richer earnings multiple. Reported profit growth of 30.7% over the past year, supported by higher net margins of 13.6% compared with 10.9% a year earlier, points to improving profitability. Earnings have also risen at an annual rate of 20.7% over the past 5 years, and the firm is described as having high quality earnings, which can justify investors paying a higher price tag for each euro of profit.
The comparison with peers sharpens the picture. While Spadel’s P/E of 26.2x is expensive relative to the wider European Beverage industry average of 17.8x, it is framed as good value against a closer peer set trading around 47.7x earnings. That mix suggests the market is pricing in a premium to the broader sector but not assigning the same valuation as some peers that carry much richer earnings multiples.
See what the numbers say about this price — find out in our valuation breakdown.
Result: Price-to-Earnings of 26.2x (ABOUT RIGHT)
Still, the narrative around Spadel can change quickly if earnings flatten while the P/E stays elevated or if parent Finances Et Industries adjusts its approach.
Find out about the key risks to this Spadel narrative.
Another view of Spadel’s value
The first pass using the P/E ratio painted Spadel as fairly priced against close peers but expensive versus the wider European Beverage group. A different lens tells a cooler story. The SWS DCF model estimates a future cash flow value of €281.62 per share, which is below the current €360 price, so on that framework the stock screens as overvalued.
Both approaches are looking at the same business yet send mixed messages on what is “reasonable” to pay today. That gap turns into a real question for you: which signal should matter more when the market mood changes, earnings multiples or cash flow value anchors?
Look into how the SWS DCF model arrives at its fair value.
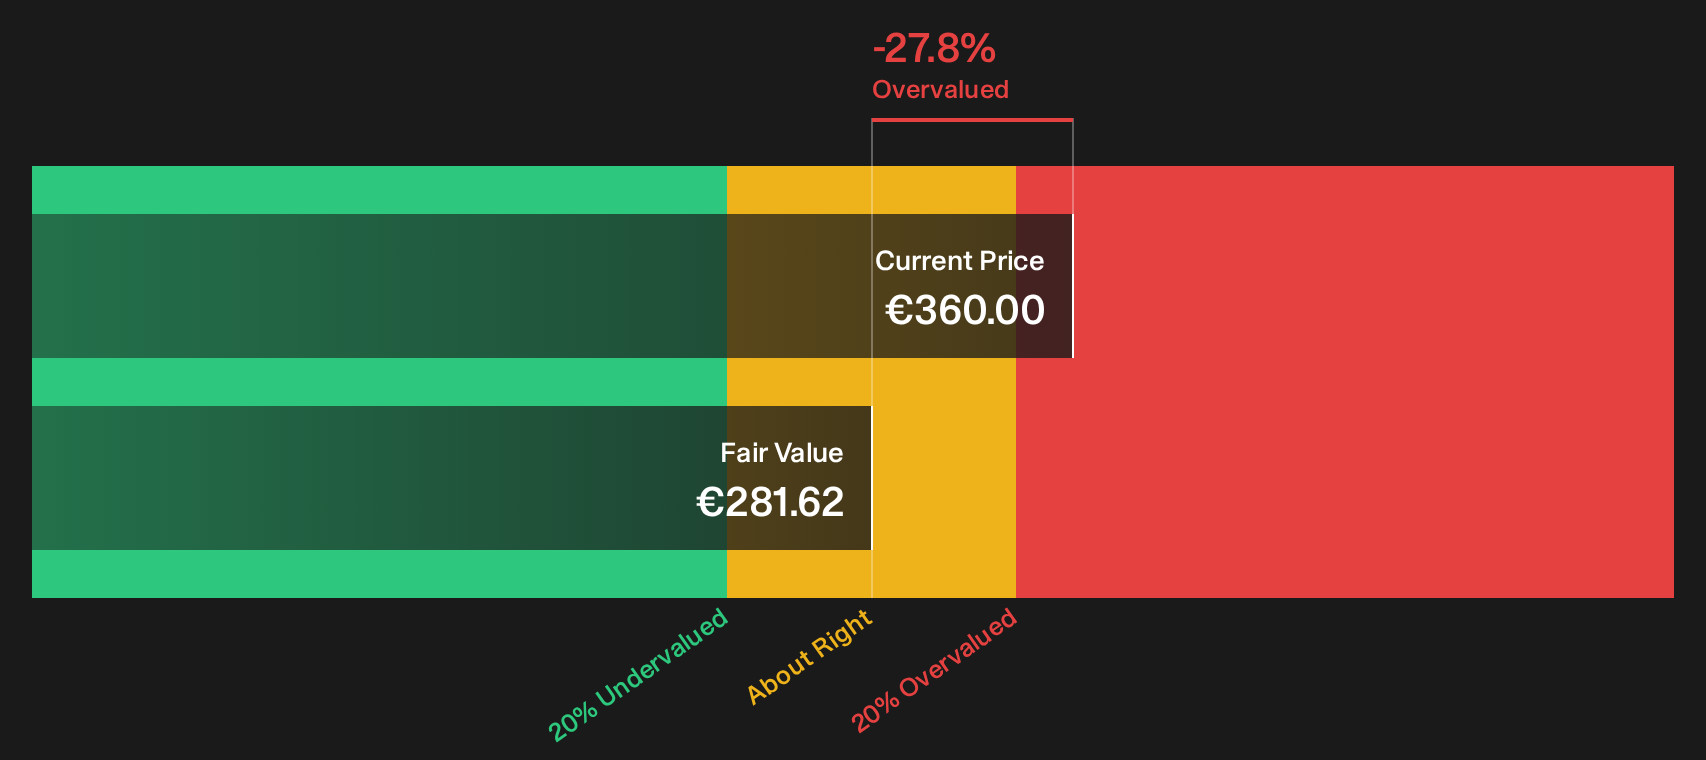
Simply Wall St performs a discounted cash flow (DCF) on every stock in the world every day (check out Spadel for example). We show the entire calculation in full. You can track the result in your watchlist or portfolio and be alerted when this changes, or use our stock screener to discover 249 high quality undervalued stocks. If you save a screener we even alert you when new companies match - so you never miss a potential opportunity.
Next Steps
Mixed signals on Spadel’s value often split opinion, so move quickly, review the full data set, and weigh both the 1 key reward and 1 important warning sign.
Looking for more investment ideas beyond Spadel?
If you want to round out your view beyond Spadel, use the Simply Wall Street Screener to quickly surface fresh ideas that fit your style and risk tolerance.
- Target potential mispricings by scanning a focused universe of 249 high quality undervalued stocks that pair solid fundamentals with prices the market may be overlooking.
- Prioritise resilience by filtering for 309 resilient stocks with low risk scores so you can focus on businesses with steadier risk profiles when markets turn choppy.
- Hunt for future leaders by tracking a curated 218 elite penny stocks with strong financials list where smaller companies show stronger financials than their size suggests.
This article by Simply Wall St is general in nature. We provide commentary based on historical data and analyst forecasts only using an unbiased methodology and our articles are not intended to be financial advice. It does not constitute a recommendation to buy or sell any stock, and does not take account of your objectives, or your financial situation. We aim to bring you long-term focused analysis driven by fundamental data. Note that our analysis may not factor in the latest price-sensitive company announcements or qualitative material. Simply Wall St has no position in any stocks mentioned.
Have feedback on this article? Concerned about the content? Get in touch with us directly. Alternatively, email editorial-team@simplywallst.com