
- PRICING
- LIVE QUOTES
- LEARN
- HELP


EN
Guangdong Investment (SEHK:270) Lifts Interim Dividend And Earnings As Valuation Questions Return
Dividend and earnings update for Guangdong Investment
Guangdong Investment (SEHK:270) drew fresh attention after announcing an interim dividend of HK$0.2919 per share, alongside half year results showing higher sales and net income compared with the prior period.
Guangdong Investment’s recent interim dividend news lands after a strong run, with a 30.34% year to date share price return and a 28.05% total shareholder return over one year. The 3 year total shareholder return of 88.83% points to momentum that has been building rather than fading.
Scan 168 dividend fortresses to see which other income focused stocks are showing similar momentum in earnings and payouts to Guangdong Investment this year.
The recent rally and richer dividend put Guangdong Investment on many radars, yet the shares still sit below analyst targets and a much higher intrinsic value estimate. Is the discount a bargain or a warning sign about market caution?
Price-to-earnings of 11.9x for Guangdong Investment: Is it justified?
On simple numbers, Guangdong Investment trades on a P/E of 11.9x, which looks rich compared with its own fair P/E estimate of 9.6x and a peer average of 7.9x, even though it sits below the wider Asian water utilities average of 13x.
The P/E ratio links the current share price to earnings per share and gives a quick sense of how much investors are willing to pay for each unit of profit. For a utility focused group like Guangdong Investment, this multiple often reflects expectations around earnings stability, regulation, and moderate growth rather than aggressive expansion.
Here, the 11.9x P/E ratio comes with mixed signals. Relative to similar companies on a 7.9x average, the stock trades on a clear premium, which points to the market assigning a higher value to its earnings than to peers. Compared with the estimated fair P/E of 9.6x, that premium looks stretched and suggests a level the valuation could drift back toward if enthusiasm cools. Against the Asian water utilities industry average of 13x, though, the shares still sit at a small discount. This indicates investors are not pricing Guangdong Investment as aggressively as some regional utilities, despite its recent earnings growth and net margin improvement.
For a closer look at how this fair ratio is calculated and what it implies for Guangdong Investment, review the Explore the SWS fair ratio for Guangdong Investment.
Result: Price-to-earnings of 11.9x (OVERVALUED)
Still, any setback in Guangdong Investment’s water resources or toll road operations, or shifts in regulation affecting its Hong Kong or Mainland China projects, could quickly challenge this optimism.
Find out about the key risks to this Guangdong Investment narrative.
Another view on Guangdong Investment's value
The P/E workup paints Guangdong Investment as expensive, yet the SWS DCF model points the other way. With the share price around HK$8.92 and the model suggesting a future cash flow value near HK$28.29, the stock appears heavily undervalued. Which signal do you rely on more?
For investors who like to see every step behind that cash flow estimate, the Look into how the SWS DCF model arrives at its fair value.
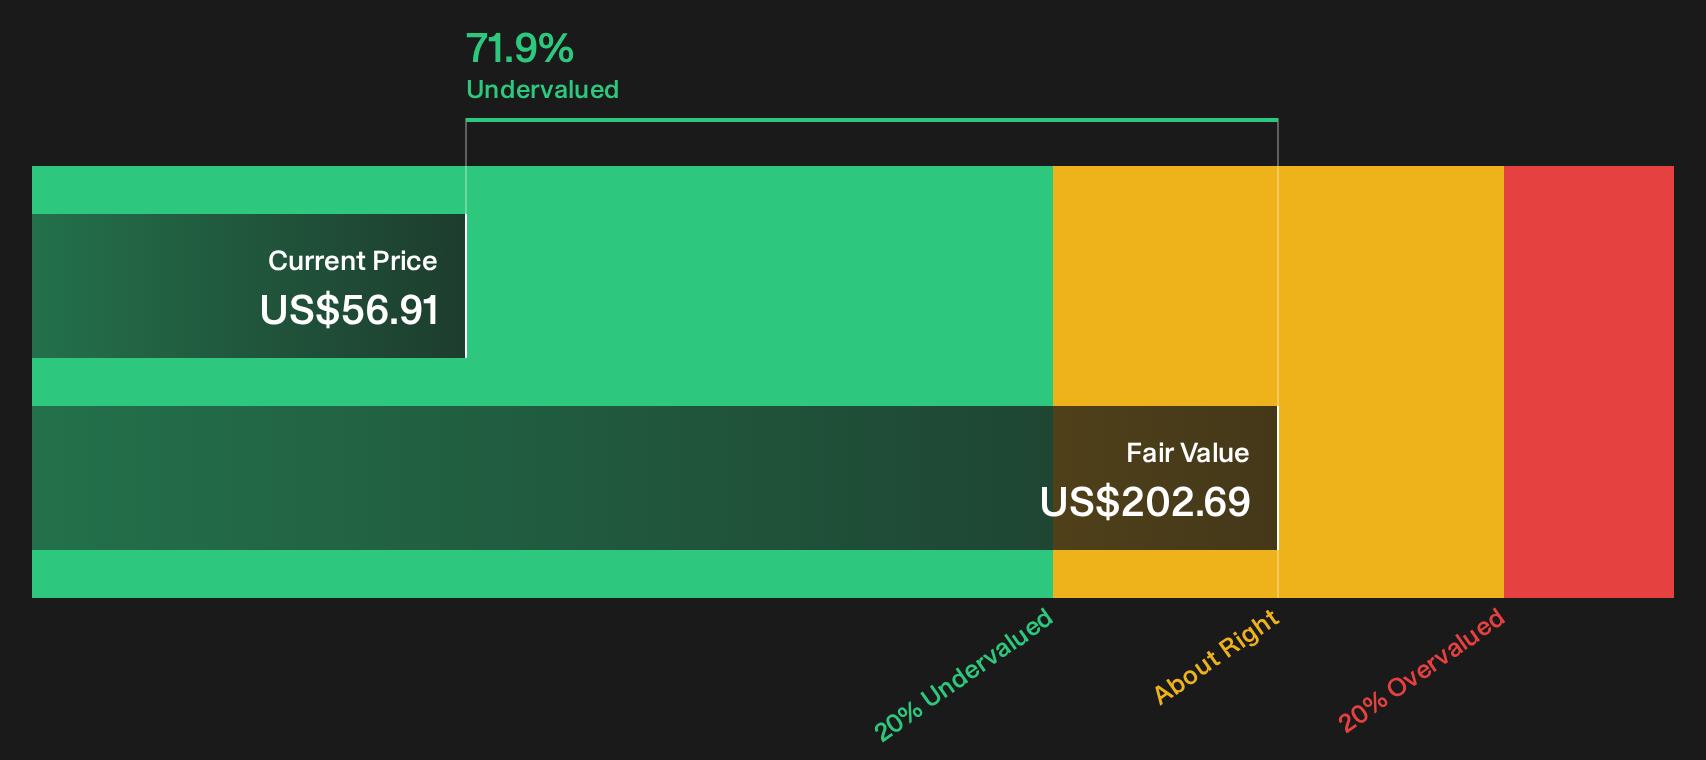
Simply Wall St performs a discounted cash flow (DCF) on every stock in the world every day (check out Guangdong Investment for example). We show the entire calculation in full. You can track the result in your watchlist or portfolio and be alerted when this changes, or use our stock screener to discover 249 high quality undervalued stocks. If you save a screener we even alert you when new companies match - so you never miss a potential opportunity.
Next Steps
Sentiment around Guangdong Investment is clearly mixed, which is exactly when doing your own homework matters most. Pull up the full breakdown of the rewards investors are excited about, alongside the risks that keep others cautious, by reviewing the 2 key rewards and 1 important warning sign.
Looking for more Guangdong Investment style ideas?
Do not stop with Guangdong Investment. Put the same level of scrutiny into fresh ideas, so your watchlist keeps evolving instead of relying on yesterday’s winners.
- Target quality at a discount and use the 249 high quality undervalued stocks to spot companies where fundamentals and current pricing point in very different directions.
- Prioritise resilience under pressure by scanning the 309 resilient stocks with low risk scores for businesses with stronger balance sheets and lower overall risk scores.
- Hunt for future leaders early and turn to the 616 high quality undiscovered gems before the wider market starts paying attention.
This article by Simply Wall St is general in nature. We provide commentary based on historical data and analyst forecasts only using an unbiased methodology and our articles are not intended to be financial advice. It does not constitute a recommendation to buy or sell any stock, and does not take account of your objectives, or your financial situation. We aim to bring you long-term focused analysis driven by fundamental data. Note that our analysis may not factor in the latest price-sensitive company announcements or qualitative material. Simply Wall St has no position in any stocks mentioned.
Have feedback on this article? Concerned about the content? Get in touch with us directly. Alternatively, email editorial-team@simplywallst.com