
- PRICING
- LIVE QUOTES
- LEARN
- HELP


EN
Norfolk Southern (NSC) Stock Could Be 21% Above Fair Value On Cash Flow
Norfolk Southern has delivered a strong 76.0% gain over the past three years, yet the stock currently screens as expensive on both intrinsic value estimates and market multiples. For anyone looking at the rail operator today, the question is whether that past share price strength still lines up with what the underlying cash flows appear to justify.
- A roughly 76.0% return over three years points to a stock that has already rewarded patience, which raises the bar for any new buyers looking for further upside.
- Future cash flow growth from the freight network can support the current share price, while any pressure on volumes, pricing, or operating efficiency may weigh heavily on what investors are willing to pay.
- A broader valuation check, where Norfolk Southern screens as attractive in only 1 of 6 tests, points to a stock that is not a clear bargain on current metrics.
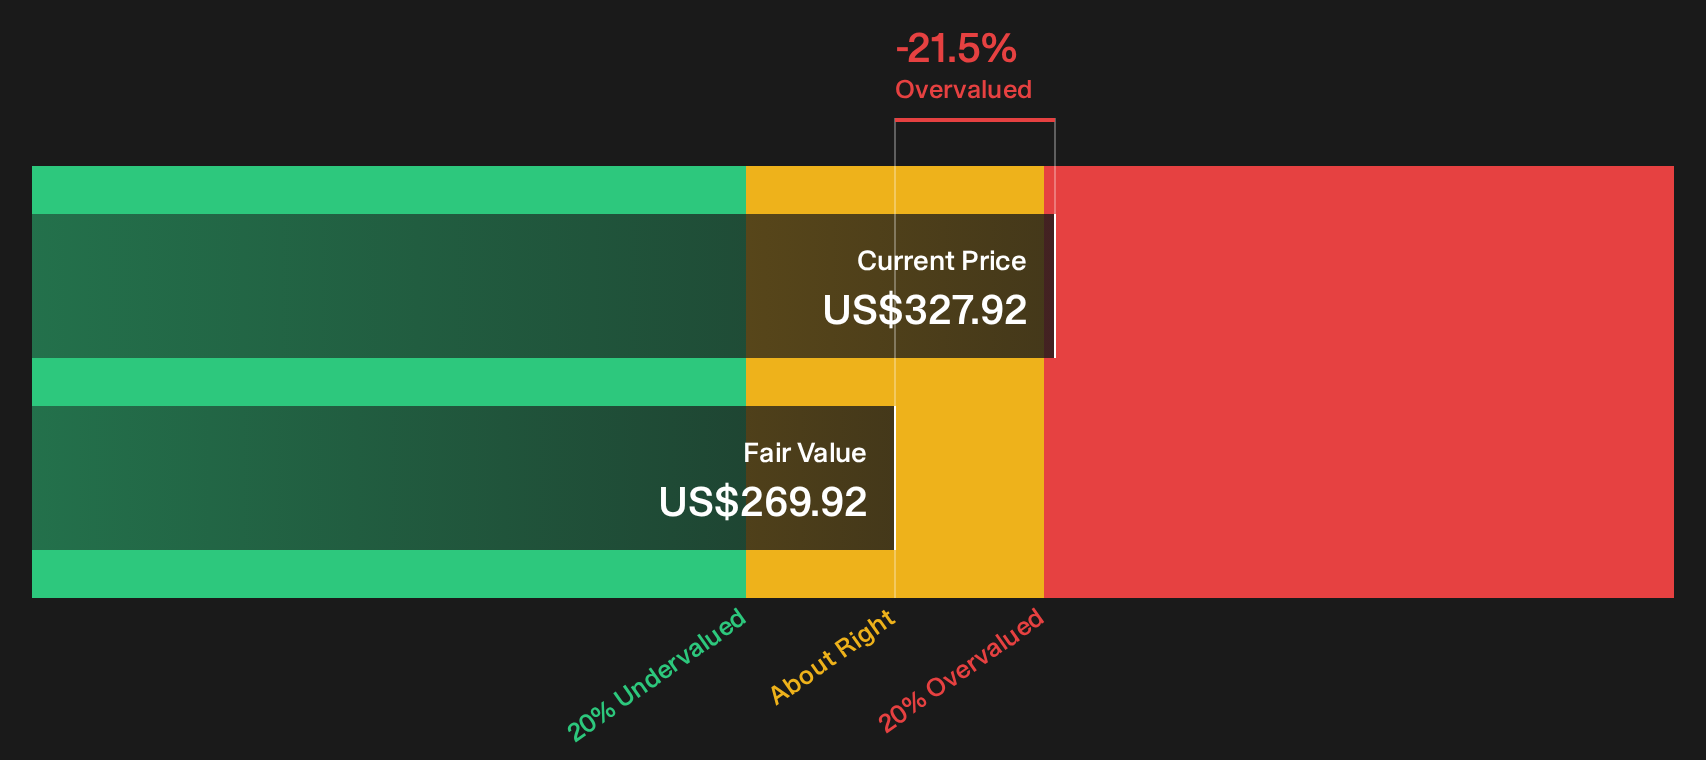
The issue now is whether Norfolk Southern's share price around US$327, given an intrinsic value estimate that points to about a 21.5% premium, leaves enough room for a margin of safety.
Scan beyond Norfolk Southern and compare it with hand-picked rail and infrastructure plays that currently screen as 49 high quality undervalued stocks.
Is Norfolk Southern Getting Expensive on Cash Flow?
The Discounted Cash Flow (DCF) model here uses projected free cash flows to estimate what Norfolk Southern could be worth based on its own cash generation. Latest twelve month free cash flow is about $853 million, and the forecast path assumes growing cash flows rather than a shrinking rail business.
On these inputs, the DCF indicates an intrinsic value around $270 per share, which is below the current price near $327. That gap of roughly 21.5% suggests the market is paying a premium to the model’s estimate for Norfolk Southern, even with projected cash flows increasing over time.
On this DCF framework, Norfolk Southern appears overvalued, with the share price trading well above the model’s estimate of intrinsic worth.
Our Discounted Cash Flow (DCF) analysis suggests Norfolk Southern may be overvalued by 21.5%. Discover 49 high quality undervalued stocks or create your own screener to find better value opportunities.
Does Norfolk Southern Look Pricey on Earnings?
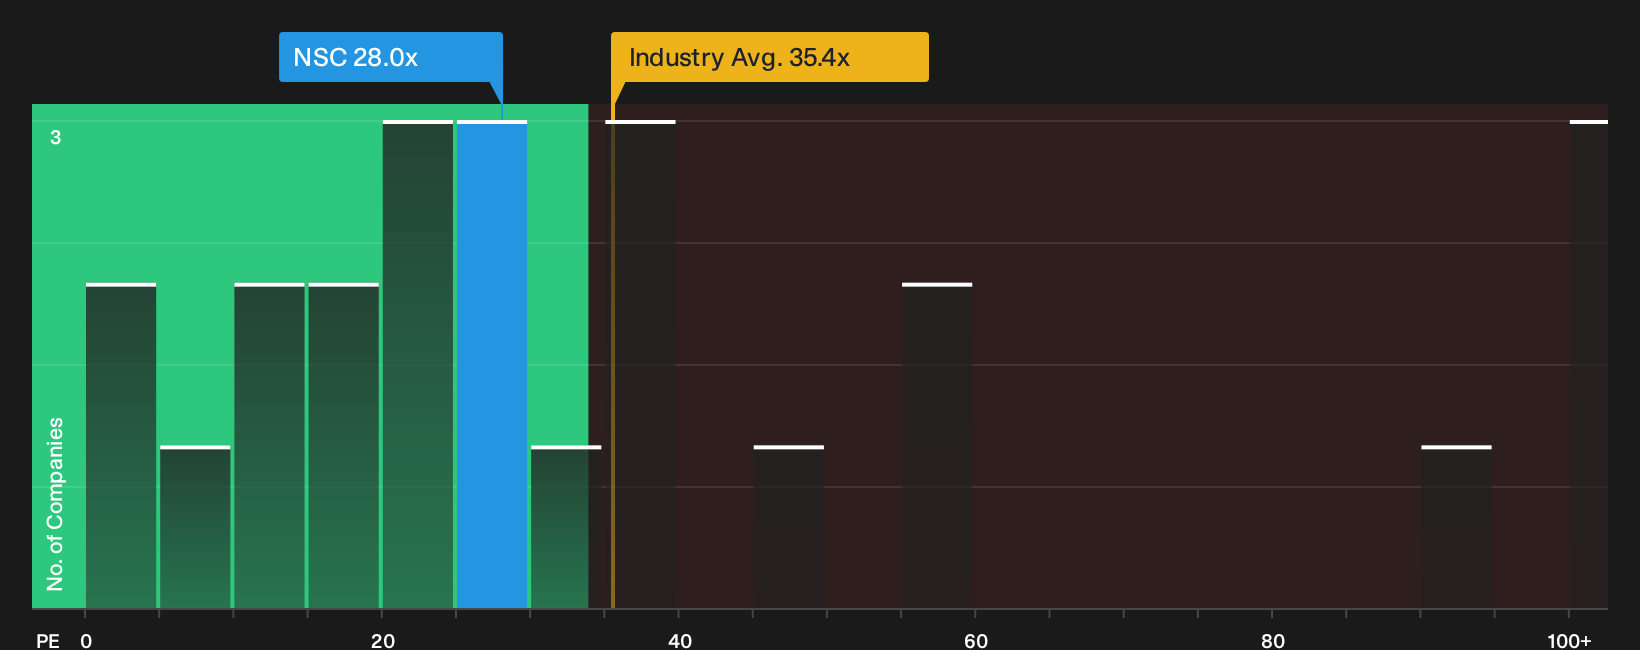
The P/E ratio suits Norfolk Southern because earnings are a key anchor for how investors typically price railroads. On this measure, the company trades at about 28.0x earnings, slightly above the peer group near 26.0x and below the broader transportation sector average of roughly 35.4x.
A tailored fair P/E for Norfolk Southern, which blends factors like profitability, size, sector and risk, sits closer to 24.5x. The current multiple is therefore a few turns higher than what that framework suggests. This points to investors already paying up for the existing earnings profile.
On the P/E yardstick, Norfolk Southern appears overvalued compared with its modelled fair multiple and its immediate peer set.
See what the numbers say about this price — find out in our valuation breakdown.
The Norfolk Southern Narrative: What Would Justify Today's Price?
Narratives for Norfolk Southern pick up where this valuation puzzle leaves off by spelling out which future paths for growth, margins and earnings would need to play out for the stock to look materially richer or cheaper than today’s quote on Simply Wall St's Community page. Each narrative treats fair value as a thesis that can be checked against how Norfolk Southern's business actually develops over time, rather than a one-off snapshot.
If you have a number driven view on where Norfolk Southern's growth, margins and execution go from here, add your voice with a Narrative in the Simply Wall St community. Set out your thesis now so you can watch how it stacks up as new results arrive.
Do you think there's more to the story for Norfolk Southern? Head over to our Community to see what others are saying!
The Bottom Line
Norfolk Southern screens as overvalued on both the Discounted Cash Flow (DCF) view and on earnings based multiples, which points to limited valuation support on current assumptions. The intrinsic value estimate sits meaningfully below the share price, while the P/E ratio also runs ahead of a tailored fair multiple. Broader checks line up with that message, since only a small slice of valuation tests flag the stock as attractive. The key debate from here is whether future cash generation and execution can grow into this richer pricing, or whether the market eventually cools on the current premium.
This article by Simply Wall St is general in nature. We provide commentary based on historical data and analyst forecasts only using an unbiased methodology and our articles are not intended to be financial advice. It does not constitute a recommendation to buy or sell any stock, and does not take account of your objectives, or your financial situation. We aim to bring you long-term focused analysis driven by fundamental data. Note that our analysis may not factor in the latest price-sensitive company announcements or qualitative material. Simply Wall St has no position in any stocks mentioned.
Have feedback on this article? Concerned about the content? Get in touch with us directly. Alternatively, email editorial-team@simplywallst.com