
- PRICING
- LIVE QUOTES
- LEARN
- HELP


EN
China National Building Material (SEHK:3323) Could Be 92% Undervalued After Loss And Chairman Exit
China National Building Material (SEHK:3323) just reported a challenging first half of the year, moving from profit to a CNY 661.19 million loss. At the same time, long-serving chairman Mr. Zhou Yuxian resigned, and executive director Mr. Wei Rushan stepped in as interim chairman.
China National Building Material’s latest results and chairman change have arrived after a tough stretch for investors, with the share price at HK$3.45 and a 30 day share price return of down 17.37%, feeding into a year to date share price return of down 32.88% and a 5 year total shareholder return of down 61.76%. This points to fading momentum and a market that appears more focused on risk than on any potential recovery for now.
Stress test your thesis on China National Building Material by comparing it with a curated 249 high quality undervalued stocks that share solid fundamentals at prices the market currently discounts.
China National Building Material now trades well below several valuation estimates, with the share price and implied fair value pulling in opposite directions after the recent loss and leadership shake up. How wide is that gap in reality?
Preferred Price-to-Sales of 0.1x: Is it justified?
On the current numbers, China National Building Material looks very cheap relative to its revenue, with the stock trading on a P/S ratio of 0.1x while the shares change hands at HK$3.45.
The P/S multiple compares the market value of the business to the sales it generates. For a group that reported revenue of CN¥176,050.02m across cement, concrete, new materials and engineering services, a 0.1x P/S implies investors are paying a relatively small amount for each unit of top line.
Analysts at Simply Wall St view that level as representing good value. The P/S of 0.1x is far lower than the peer average of 7.6x and is also well below the estimated fair P/S ratio of 0.6x that the SWS model identifies as a level the market could logically move towards if sentiment or expectations change.
Against the broader Asian Basic Materials group, China National Building Material again screens cheaply, with its 0.1x P/S comparing to an industry average of 1.1x. That kind of gap suggests the market is heavily discounting current and forecast cash generation relative to similar businesses in the region.
Explore the SWS fair ratio for China National Building Material
Result: Price-to-sales of 0.1x (UNDERVALUED)
Still, China National Building Material faces clear risks, including the recent leadership change and a reported CN¥5,934.93m net loss, which could keep sentiment fragile.
Find out about the key risks to this China National Building Material narrative.
Another View on China National Building Material’s Value
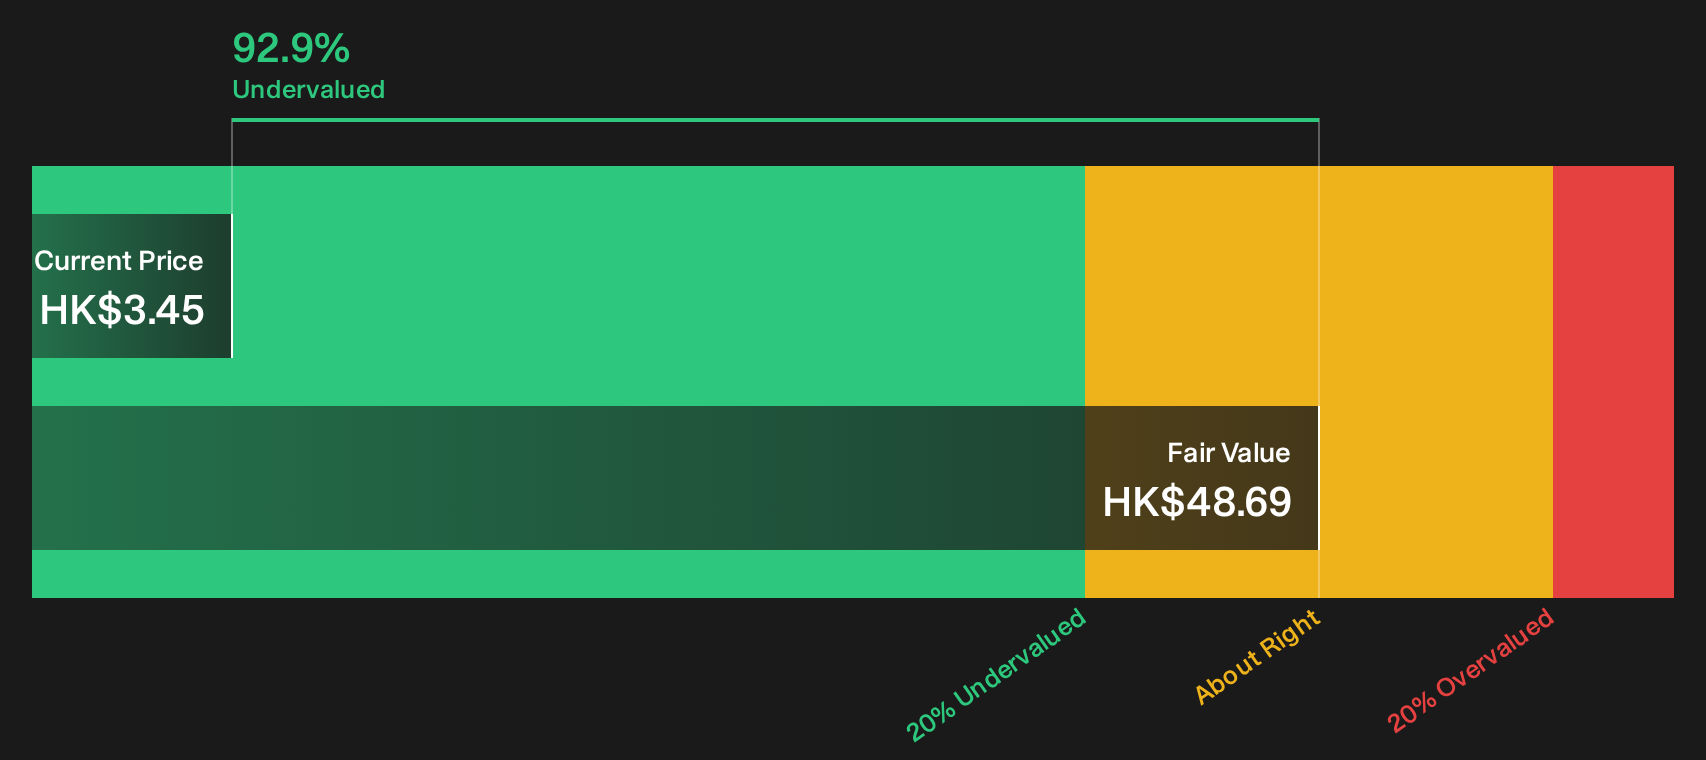
There is a very different picture when you look at China National Building Material through the SWS DCF model. At HK$3.45, the stock trades about 92.9% below an estimated fair value of HK$48.69, which points to a deep discount on projected future cash flows.
That kind of gap can signal either a severe mispricing or serious doubts about those cash flow assumptions. Which side of that trade do you think you are on as sentiment and fundamentals evolve from here?
Look into how the SWS DCF model arrives at its fair value.
Simply Wall St performs a discounted cash flow (DCF) on every stock in the world every day (check out China National Building Material for example). We show the entire calculation in full. You can track the result in your watchlist or portfolio and be alerted when this changes, or use our stock screener to discover 249 high quality undervalued stocks. If you save a screener we even alert you when new companies match - so you never miss a potential opportunity.
Next Steps
Sentiment around China National Building Material is clearly split, with material risks on one side and meaningful potential on the other. Move quickly, review the underlying figures yourself and pressure test every assumption against the 3 key rewards and 3 important warning signs.
Looking for more ideas beyond China National Building Material?
If China National Building Material has sharpened your focus on valuation and risk, do not stop here. Use the screeners below to pressure test fresh ideas and avoid missing opportunities hiding in plain sight.
- Target resilient compounding potential by scanning a 168 dividend fortresses that may appeal if you want income with more than just headline yield.
- Hunt for quality at a discount by reviewing a 615 high quality undiscovered gems that puts financially sound but less crowded opportunities on your radar.
- Reduce sleepless nights by filtering for a 308 resilient stocks with low risk scores that focuses on businesses with sturdier financial and risk profiles.
This article by Simply Wall St is general in nature. We provide commentary based on historical data and analyst forecasts only using an unbiased methodology and our articles are not intended to be financial advice. It does not constitute a recommendation to buy or sell any stock, and does not take account of your objectives, or your financial situation. We aim to bring you long-term focused analysis driven by fundamental data. Note that our analysis may not factor in the latest price-sensitive company announcements or qualitative material. Simply Wall St has no position in any stocks mentioned.
Have feedback on this article? Concerned about the content? Get in touch with us directly. Alternatively, email editorial-team@simplywallst.com