
- PRICING
- LIVE QUOTES
- LEARN
- HELP


EN
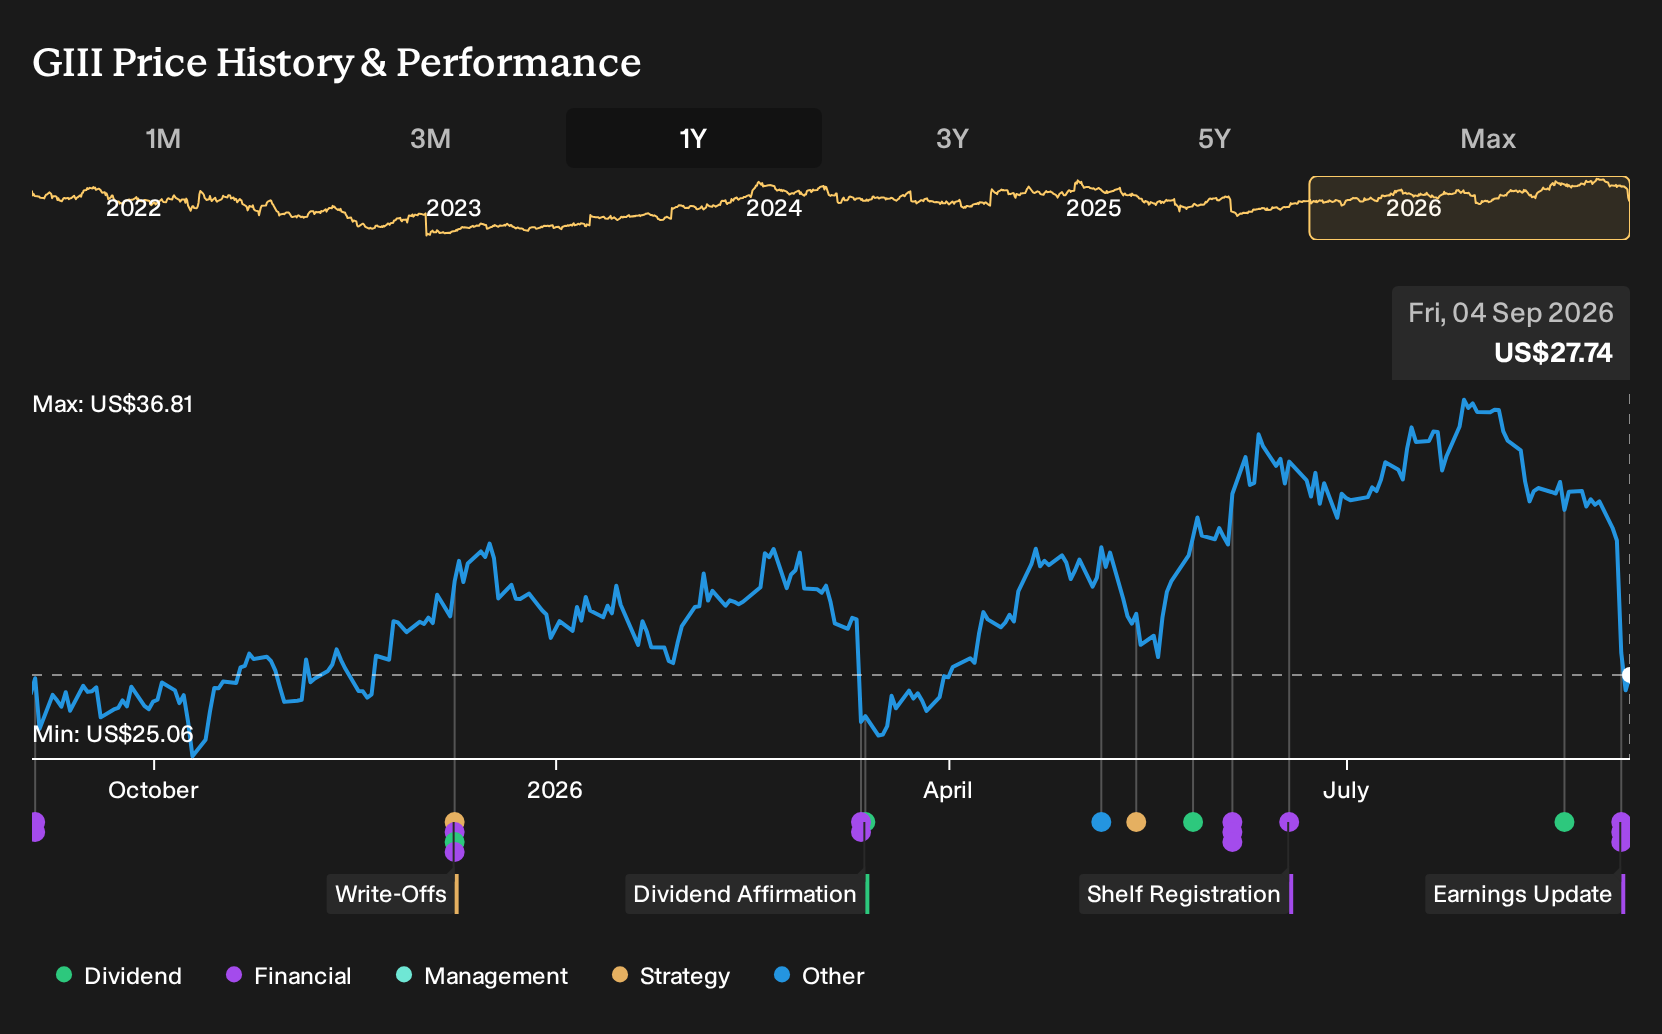
Why G-III Apparel Group (GIII) Is Down 14.9% After Raising Earnings Outlook On Lower Sales
- In early September 2026, G-III Apparel Group, Ltd. reported second-quarter results showing lower sales of about US$554.09 million but higher net income of roughly US$20.21 million, while issuing guidance for third-quarter and full-year fiscal 2027 that points to reduced sales but higher expected profitability.
- The company also raised its full-year earnings outlook and highlighted the completed Marc Jacobs acquisition as it shifts its business mix toward owned brands and away from lost Calvin Klein and Tommy Hilfiger licensed revenue.
- Against this backdrop, we will examine how the raised full-year earnings guidance reshapes G-III Apparel Group’s broader investment narrative.
The latest GPUs need a type of rare earth metal called Terbium and there are only 31 companies in the world exploring or producing it. Find the list for free.
What Is G-III Apparel Group's Investment Narrative?
To own G-III Apparel Group today, you really have to believe in its shift from big licensed labels toward a portfolio anchored by owned brands like Marc Jacobs, while accepting a smaller revenue base. The latest results and guidance fit that story: management is openly trading lower sales, including the loss of about US$460 million from Calvin Klein and Tommy Hilfiger, for higher profitability and a richer mix of owned brands. The raised full-year earnings outlook reinforces that margin focus and partly reframes the near-term catalysts. Instead of waiting on a revenue rebound, the key questions now center on whether G-III can sustain higher earnings quality, integrate Marc Jacobs cleanly and make its lower price-to-earnings multiple look justified. After the recent share price pullback, that profitability message becomes more material to the thesis than before.
However, investors should also weigh how dependent this shift is on smooth Marc Jacobs execution. G-III Apparel Group's share price has been on the slide but might be up to 16% below fair value. Find out if it's a bargain.Exploring Other Perspectives
Explore 3 other fair value estimates on G-III Apparel Group - why the stock might be worth 14% less than the current price!
The Verdict Is Yours
Don't just follow the ticker - dig into the data and build a conviction that's truly your own.
- A great starting point for your G-III Apparel Group research is our analysis highlighting 2 key rewards and 1 important warning sign that could impact your investment decision.
- Our free G-III Apparel Group research report provides a comprehensive fundamental analysis summarized in a single visual - the Snowflake - making it easy to evaluate G-III Apparel Group's overall financial health at a glance.
Ready To Venture Into Other Investment Styles?
Our top stock finds are flying under the radar-for now. Get in early:
- Find 47 companies with promising cash flow potential yet trading below their fair value.
- This technology could replace computers: discover 25 stocks that are working to make quantum computing a reality.
- The best AI stocks today may lie beyond giants like Nvidia and Microsoft. Find the next big opportunity with these 19 smaller AI-focused companies with strong growth potential through early-stage innovation in machine learning, automation, and data intelligence that could fund your retirement.
This article by Simply Wall St is general in nature. We provide commentary based on historical data and analyst forecasts only using an unbiased methodology and our articles are not intended to be financial advice. It does not constitute a recommendation to buy or sell any stock, and does not take account of your objectives, or your financial situation. We aim to bring you long-term focused analysis driven by fundamental data. Note that our analysis may not factor in the latest price-sensitive company announcements or qualitative material. Simply Wall St has no position in any stocks mentioned.
Have feedback on this article? Concerned about the content? Get in touch with us directly. Alternatively, email editorial-team@simplywallst.com