
- PRICING
- LIVE QUOTES
- LEARN
- HELP


EN
Black Stone Minerals (BSM) Stock Still Trades Below Fair Value
Black Stone Minerals has delivered strong longer term gains, yet at around US$14.65 the stock still screens as undervalued on traditional market multiples, which contrasts with its only mixed overall value score. For investors, that combination raises the question of how much of the past five year performance is already reflected in the current price.
- Over the past 5 years, Black Stone Minerals has returned about 128.5%, which puts recent short term share price moves into a longer term context of solid wealth creation for shareholders.
- The valuation can be influenced by how consistently Black Stone Minerals converts its royalty income into cash and distributes it, while exposure to commodity price swings may limit how much investors are willing to pay for that cash flow stream.
- On the broader checks, the stock earns a mixed verdict, with a value score of 4 out of 6 that suggests it is not a clear bargain or clearly overpriced on the available metrics.
The issue now is whether Black Stone Minerals offers enough valuation support at today’s price to appeal to investors who are weighing that track record against the current multiple based signals.
Spot opportunities that look similar to Black Stone Minerals' mix of strong long term returns and an undervalued multiple by scanning our hand picked 49 high quality undervalued stocks.Is Black Stone Minerals Still Cheap on Earnings?
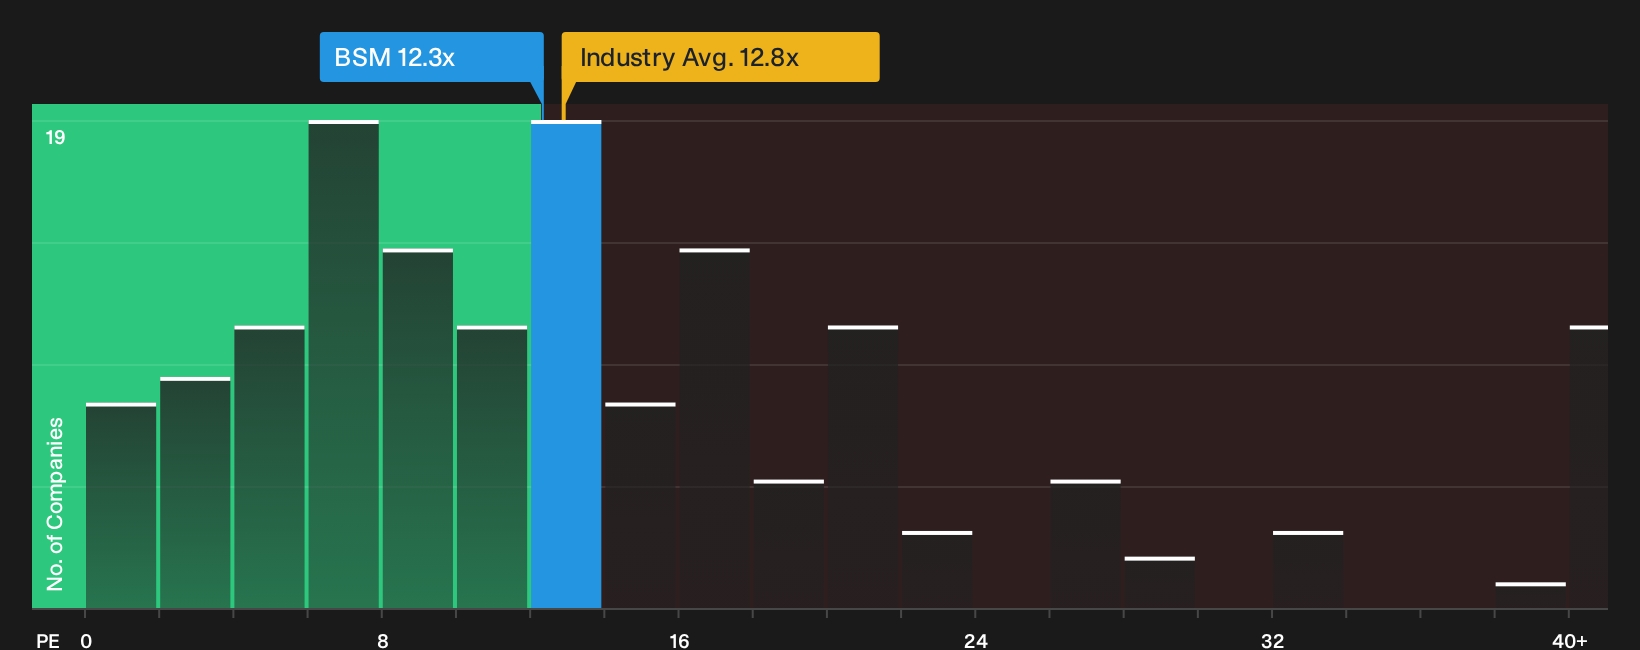
The P/E ratio is a reasonable way to look at Black Stone Minerals because earnings are a direct output of its royalty model. On this measure, the stock trades on about 12.3x earnings. That is slightly below the Oil and Gas industry average P/E of 12.8x and modestly above the peer group average of 11.0x, so the headline multiple on its own does not indicate that the stock is clearly cheap or expensive.
A more tailored benchmark is the fair P/E ratio of 16.6x, which reflects what investors might typically pay given Black Stone Minerals' sector, profitability profile and risk characteristics. Compared with that yardstick, the current 12.3x P/E suggests a sizeable discount. For investors, the key question is whether the business quality and earnings stream justify a multiple closer to that fair level over time.
On the P/E multiple, Black Stone Minerals currently appears undervalued relative to what the fair ratio suggests investors might usually pay.
See what the numbers say about this price — find out in our valuation breakdown.
The Black Stone Minerals Narrative: What Would Justify Today's Price?
Simply Wall St Narratives for Black Stone Minerals act as a bridge from the valuation puzzle above to concrete scenarios for what happens next. Each one spells out which combination of growth, margins and earnings, along with key risks, would need to occur for Black Stone Minerals' current price to look materially higher or lower. Each narrative also links its number to a specific view that you can revisit on the Community page as new information emerges.
Share a narrative on Black Stone Minerals' mix of long term returns, income profile and current valuation to put your own number driven case on record and see how it holds up as new results and data points arrive.
This is a chance to add your voice to the Simply Wall St community with a clear view on where Black Stone Minerals' growth, margins and execution could go from here.
Do you think there's more to the story for Black Stone Minerals? Head over to our Community to see what others are saying!
The Bottom Line
For Black Stone Minerals, the current P/E discount points to a stock that still screens as undervalued on earnings compared with what investors typically pay for similar businesses. The mixed broader checks suggest that this is not a straightforward bargain and that some of the quality, risk and cyclicality factors are already reflected in the price. The key consideration from here is whether the market remains comfortable with the royalty cash flow profile and eventually moves the multiple closer to the fair ratio, or whether that discount remains a lasting reflection of perceived risk.
This article by Simply Wall St is general in nature. We provide commentary based on historical data and analyst forecasts only using an unbiased methodology and our articles are not intended to be financial advice. It does not constitute a recommendation to buy or sell any stock, and does not take account of your objectives, or your financial situation. We aim to bring you long-term focused analysis driven by fundamental data. Note that our analysis may not factor in the latest price-sensitive company announcements or qualitative material. Simply Wall St has no position in any stocks mentioned.
Have feedback on this article? Concerned about the content? Get in touch with us directly. Alternatively, email editorial-team@simplywallst.com