
- PRICING
- LIVE QUOTES
- LEARN
- HELP


EN
Exploring Undiscovered Gems In Asia Featuring Three Promising Small Caps
In recent months, the Asian markets have experienced mixed performances, with technology and semiconductor stocks showing volatility amidst global economic shifts. As investors navigate these dynamic conditions, identifying promising small-cap companies can offer unique opportunities for growth. In this context, finding a good stock often involves looking for companies that demonstrate resilience in their financials and have potential to capitalize on emerging trends like AI and technological advancements.
Top 10 Undiscovered Gems With Strong Fundamentals In Asia
| Name | Debt To Equity | Revenue Growth | Earnings Growth | Health Rating |
|---|---|---|---|---|
| Cybozu | 0.16% | 17.06% | 54.02% | ★★★★★★ |
| SPRIX | 13.12% | 6.95% | -5.71% | ★★★★★★ |
| Chongqing Machinery & Electric | 18.92% | 8.39% | 25.87% | ★★★★★★ |
| Envipro Holdings | 34.26% | -1.74% | -14.46% | ★★★★★★ |
| Forth Smart Service | 44.85% | -3.80% | 10.19% | ★★★★★☆ |
| Dmall | 59.68% | 15.24% | 23.16% | ★★★★★☆ |
| Shanghai Fudan Microelectronics Group | 16.49% | 9.29% | -6.62% | ★★★★★☆ |
| Sing Investments & Finance | 0.10% | 5.85% | 7.00% | ★★★★☆☆ |
| Shengda ResourcesLtd | 57.58% | 8.61% | 9.90% | ★★★☆☆☆ |
| HANA Micron | 137.37% | 21.15% | 26.62% | ★★★☆☆☆ |
Let's review some notable picks from our screened stocks.
Sing Investments & Finance (SGX:S35)
Simply Wall St Value Rating: ★★★★☆☆
Overview: Sing Investments & Finance Limited offers financing and related nominee services to individuals and corporations in Singapore, with a market capitalization of SGD373.57 million.
Operations: The primary revenue stream for Sing Investments & Finance Limited is its financing business and related nominee services, generating SGD85.99 million. The company's net profit margin reflects its profitability from these operations.
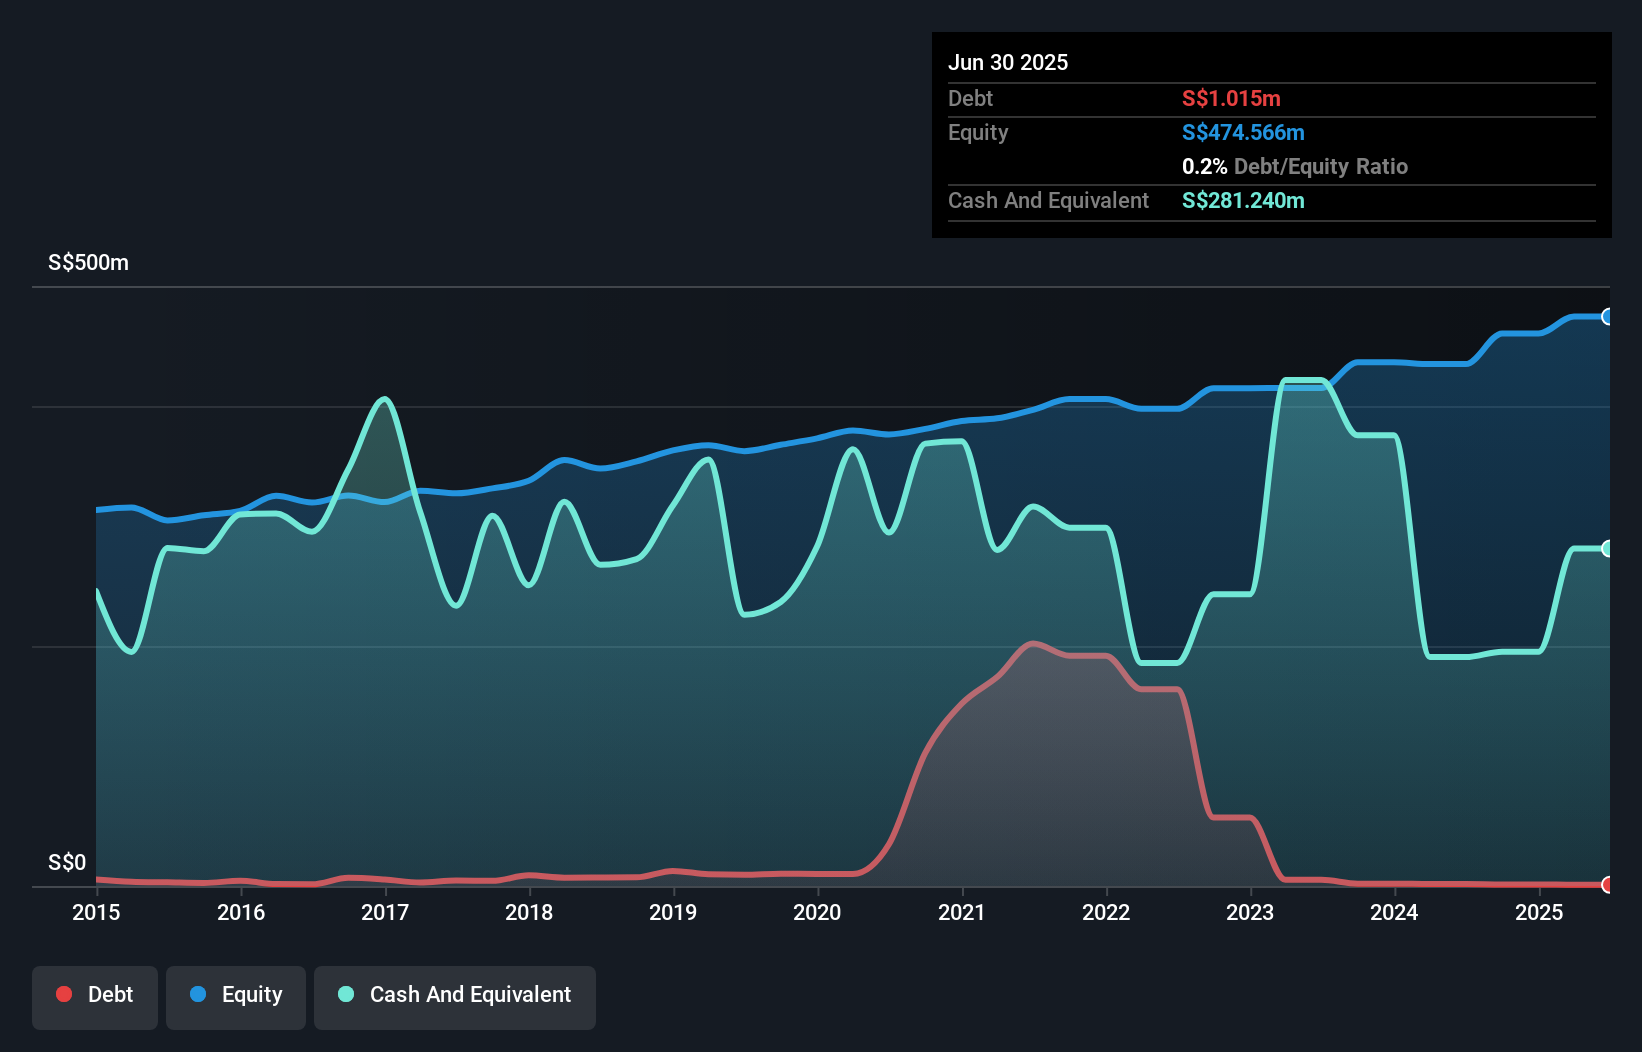
Sing Investments & Finance, a small financial entity in Asia, offers an intriguing profile with its debt-to-equity ratio significantly reduced from 50.9% to 0.1% over five years, highlighting prudent financial management. Despite not outpacing the Consumer Finance industry’s earnings growth of 21.6%, it posted a respectable 9.2%. The company trades at a notable discount of 26.4% below estimated fair value, suggesting potential upside for investors seeking undervalued opportunities. Recent earnings results show net income climbing to SGD 25.17 million from SGD 21.7 million year-on-year, reflecting steady progress in profitability amid industry challenges.
Shenzhen Highpower Technology (SZSE:001283)
Simply Wall St Value Rating: ★★★★★☆
Overview: Shenzhen Highpower Technology Co., Ltd. specializes in the research, design, development, manufacture, and sale of lithium-ion and nickel-metal hydride (Ni-MH) batteries both in China and globally, with a market capitalization of CN¥6.20 billion.
Operations: Shenzhen Highpower Technology generates revenue through the sale of lithium-ion and nickel-metal hydride batteries. The company operates both domestically in China and internationally, contributing to its market capitalization of CN¥6.20 billion.
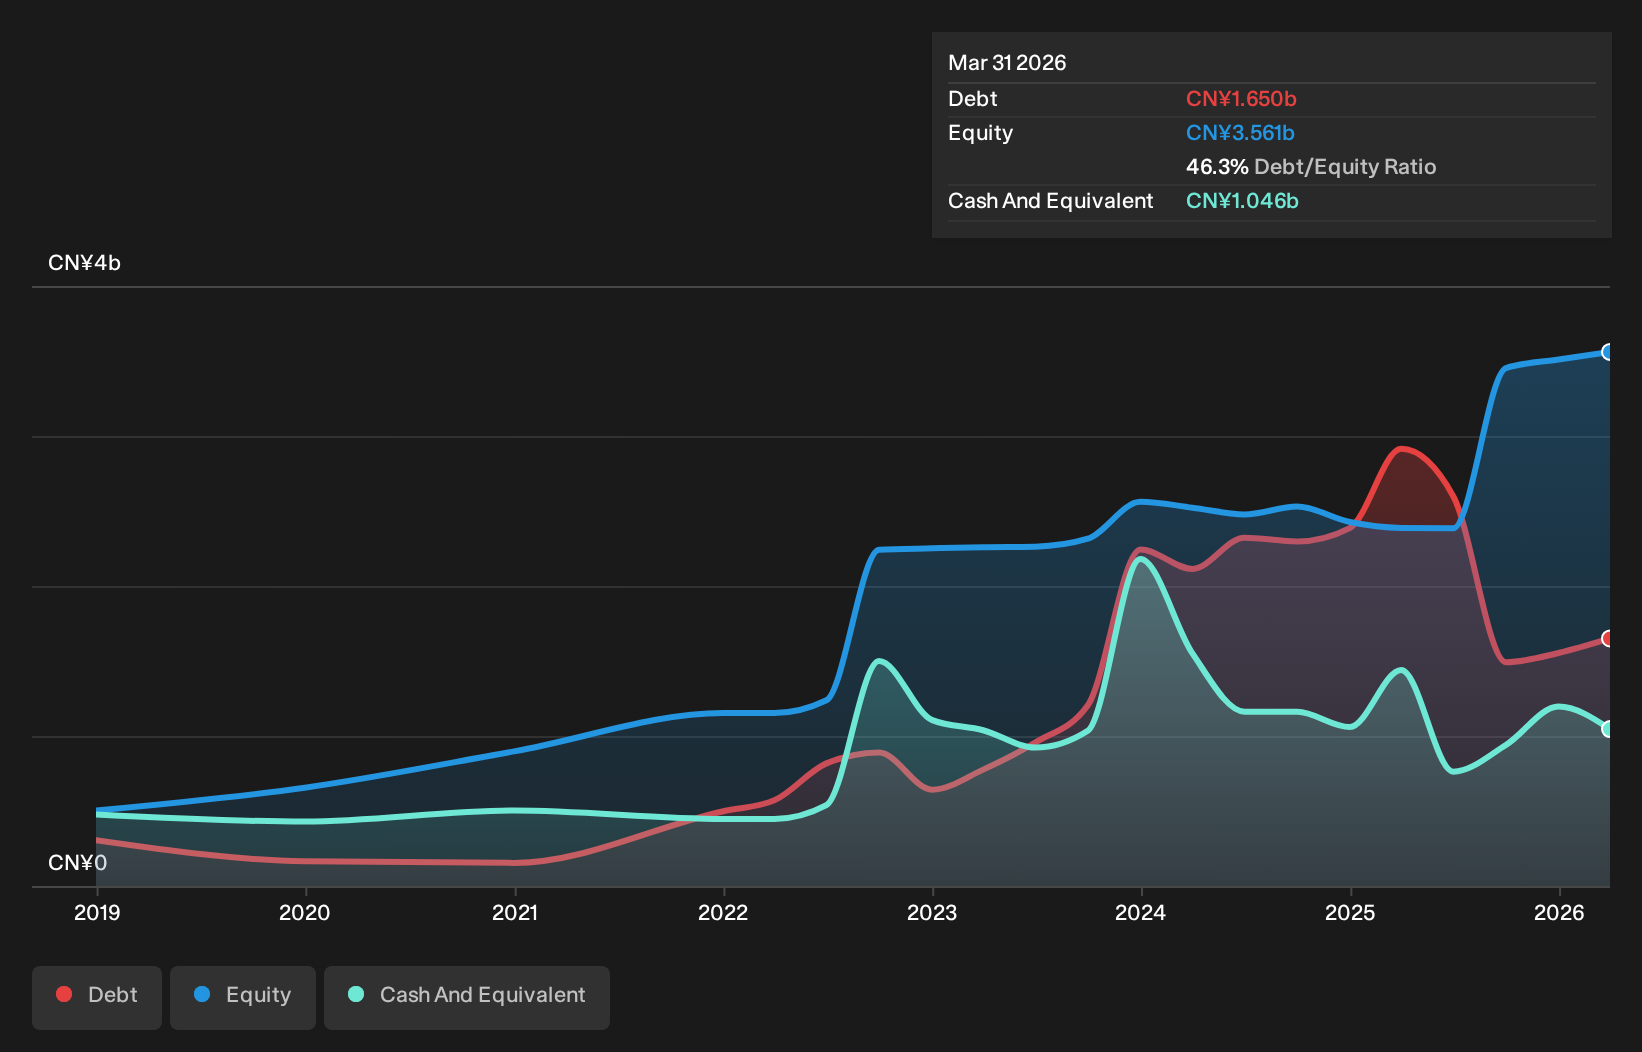
Shenzhen Highpower Technology, a nimble player in the energy sector, shows promising growth with earnings surging by 42.8% last year, outpacing the Electrical industry average of 0.2%. The company reported half-year sales of CNY 3.18 billion, climbing from CNY 2.76 billion a year prior, while net income reached CNY 122.93 million compared to CNY 96.71 million previously. Despite trading at nearly 60% below its estimated fair value and having satisfactory debt levels with a net debt to equity ratio of 17%, free cash flow remains negative due to substantial capital expenditures over recent years.
- Click to explore a detailed breakdown of our findings in Shenzhen Highpower Technology's health report.
Gain insights into Shenzhen Highpower Technology's past trends and performance with our Past report.
JM HoldingsLtd (TSE:3539)
Simply Wall St Value Rating: ★★★★★☆
Overview: JM Holdings Co., Ltd. operates in the supermarket sector across Japan with a market capitalization of approximately ¥73.79 billion.
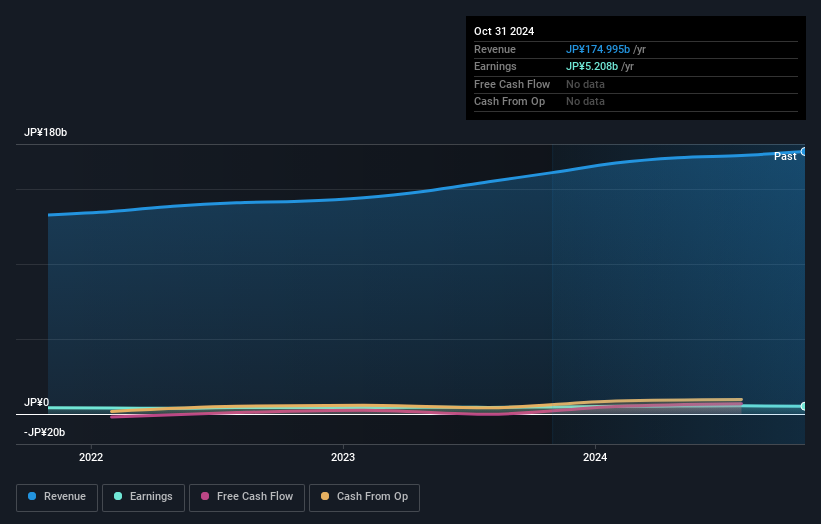
Operations: JM Holdings Co., Ltd. generates its revenue primarily from its supermarket business, which accounted for ¥191.99 billion. The company has a market capitalization of approximately ¥73.79 billion.
With its earnings growth of 3.5% outpacing the Consumer Retailing industry at 3.3%, JM Holdings Ltd. presents a compelling case in the market, trading at a significant discount of 68.2% below estimated fair value, suggesting potential undervaluation. The company boasts high-quality past earnings and impressive interest coverage with EBIT covering interest payments by an astounding 773 times, indicating robust financial health. However, the debt-to-equity ratio has risen slightly from 16.3% to 18% over five years, which could be a point of consideration for investors evaluating financial leverage trends in this small-cap stock's performance profile.
- Unlock comprehensive insights into our analysis of JM HoldingsLtd stock in this health report.
Gain insights into JM HoldingsLtd's historical performance by reviewing our past performance report.
Turning Ideas Into Actions
- Explore the 113 names from our Asian Undiscovered Gems With Strong Fundamentals screener here.
- Already own these companies? Bring clarity to your investment decisions by linking up your portfolio with Simply Wall St, where you can monitor all the vital signs of your stocks effortlessly.
- Join a community of smart investors by using Simply Wall St. It's free and delivers expert-level analysis on worldwide markets.
Seeking Other Investments?
- Explore high-performing small cap companies that haven't yet garnered significant analyst attention.
- Fuel your portfolio with companies showing strong growth potential, backed by optimistic outlooks both from analysts and management.
- Find companies with promising cash flow potential yet trading below their fair value.
This article by Simply Wall St is general in nature. We provide commentary based on historical data and analyst forecasts only using an unbiased methodology and our articles are not intended to be financial advice. It does not constitute a recommendation to buy or sell any stock, and does not take account of your objectives, or your financial situation. We aim to bring you long-term focused analysis driven by fundamental data. Note that our analysis may not factor in the latest price-sensitive company announcements or qualitative material. Simply Wall St has no position in any stocks mentioned.
Have feedback on this article? Concerned about the content? Get in touch with us directly. Alternatively, email editorial-team@simplywallst.com