- PRICING
- LIVE QUOTES
- LEARN
- HELP


EN
Kerui: The popularity of the land market continued to decline in August, high-priced land in Beijing and Shanghai led steady transactions in core cities
The Zhitong Finance App learned that in August 2026, Kerui Real Estate published an article stating that in August 2026, the overall land market cooled down further, the transaction side clearly weakened, and the premium rate fell back to the single-digit range, yet high-quality residential land in core cities remained somewhat popular. According to Kerui data, the construction area of the 50 key cities in the month was 12.3073 million square meters, down 37.2% year on year and 25.7% month on month; land transaction area was 6.0308 million square meters, down 32.4% year on year and 31.3% month on month; the average premium rate fell back to 7.68%, down 7.25 percentage points from July, but still 1.51 percentage points higher than the same period last year. High-value land plots in key cities such as Beijing and Shanghai have all been sold, and core high-quality assets are still very attractive to capital.
Key Takeaways
Supply and demand: The performance of supply and demand was divided. The supply and construction surface rebounded 25.7% month-on-month but fell 37.2% year over year. The construction volume of transactions fell 31.3% month-on-month and 32.4% year on year. Land transactions declined again after shrinking in July. In terms of land supply structure, cities such as Chongqing and Zhangzhou rank high in terms of volume, while core cities such as Beijing and Shanghai maintain a high share of high-quality land plots, while third- and fourth-tier cities are still less active in supplying land.
Popularity: The average premium rate fell back to 7.68%, down 7.25 percentage points from July, but still 1.51 percentage points higher than the same period last year. The market popularity center has declined markedly from the first half of the year. The auction rate rebounded to 3.77%, up 1.82 percentage points from July, but it is still relatively low, and housing companies are becoming more cautious in acquiring land; core plots in Beijing and Shanghai can still achieve certain premiums, and ultra-high premium transactions have basically disappeared.
Region: Urban performance continues to diverge, with Beijing leading the country's total transaction price with 24.697 billion yuan, followed by Shanghai with 24.661 billion yuan, almost equal to the two; among second-tier cities, Chengdu, Dongguan, and Wuhan remained active. Judging from the three lists of total price, unit price, and premium rate, Shanghai and Beijing occupy the top positions in total price and unit price. Cities such as Wuhan, Nanning, Nanchang, and Dalian rank in the premium rate list due to scarce local land supply, and the “strong always strong” pattern of land value in core cities continues.
Transactions are weakening without changing the popularity of structures, and core cities are still the main battlegrounds for capital
The August land market data conveyed three core signals: first, the market popularity center declined downward, and the average premium rate fell to a single-digit range of 7.68%. Housing companies' bidding trend was cautious, and ultra-high premium transactions basically disappeared; second, monthly fluctuations in the pace of land supply were a normal phenomenon. The month-on-month recovery in supply and construction in August was more of a rhythm adjustment after the previous contraction, while the trading end weakened further from July; third, the characteristics of structural differentiation of the market were further strengthened, with high total price and high unit price plots concentrated in Beijing, Shanghai, etc. In strong second-tier cities, the popularity of the land market in third- and fourth-tier cities is relatively low.
Judging from the driving logic, the core support of the current market is still the effective implementation of the supply-side “quality improvement and reduction” strategy. Core cities continue to launch high-quality land plots with mature support and strong certainty of removal, effectively reducing housing companies' land acquisition risk expectations. At the same time, demand from leading housing enterprises, especially central enterprises, to replenish inventory in core cities continues to be released, further confirming the trend of concentrating leading capital on core assets, while the participation of small and medium-sized private housing enterprises is limited.
Looking ahead to the future market, the central level announced a series of new policies on August 28, including: implementing existing housing sales, pre-sale capping, and full capital supervision on the sales side; extending individual loan terms to 40 years, “handing over and repaying the loan”, etc.; supporting the refinancing of listed housing enterprises, mergers, acquisitions, restructuring, and REITs expansion to promote housing enterprise financing from “relying on entity credit” to “based on project conditions”. The impact on land acquisition by central state-owned enterprises will show significant structural differentiation characteristics: central state-owned enterprises compete for high-quality land plots in core cities with convenient financing and capital advantages Medium advantages will be further expanded; small and medium-sized private enterprises are constrained by sales Due to the slowdown in repayments and the narrowing of financing channels, participation in land acquisition is expected to remain low.
Supply rebounded month-on-month, total transaction volume declined, and the value of core cities highlighted
In terms of land supply, in August 2026, the scale of land supply in the 50 key cities rebounded month-on-month after a phased reduction in July, but there was still a significant year-on-year decline. 106 lots were supplied in a single month, with a total land supply area of about 12.3073 million square meters, a year-on-year decrease of 37.2% and a month-on-month increase of 25.7%. Among them:
Among first-tier cities, Shanghai has a construction area of about 599,300 square meters, ranking first among first-tier cities; Beijing has a construction area of about 329,400 square meters, Guangzhou has a construction area of about 67,800 square meters, and Shenzhen has a construction area of about 26,000 square meters. The overall pace of land supply in first-tier cities has slowed down.
Among second-tier cities, Chongqing has the highest supply scale in the country, with a supply floor area of about 1,663,800 square meters; Jinan, Wuhan, and Hefei also reached 8461,000 square meters, 667,600 square meters, and 663,300 square meters respectively, ranking among the top second-tier cities; cities such as Chengdu, Shenyang, Zhengzhou, and Changzhou also have prominent supply volumes, and the land supply structure is still dominated by high-energy cities.
Among the third- and fourth-tier cities, Zhangzhou supplies about 1,6301,000 square meters, ranking first in the third and fourth tier; cities such as Nantong, Yangzhou, Jingdezhen, Huainan, Xuzhou, and Wenzhou are also prominent in terms of supply scale, but most third- and fourth-tier cities have low or zero land supply, and there is obvious differentiation between cities.
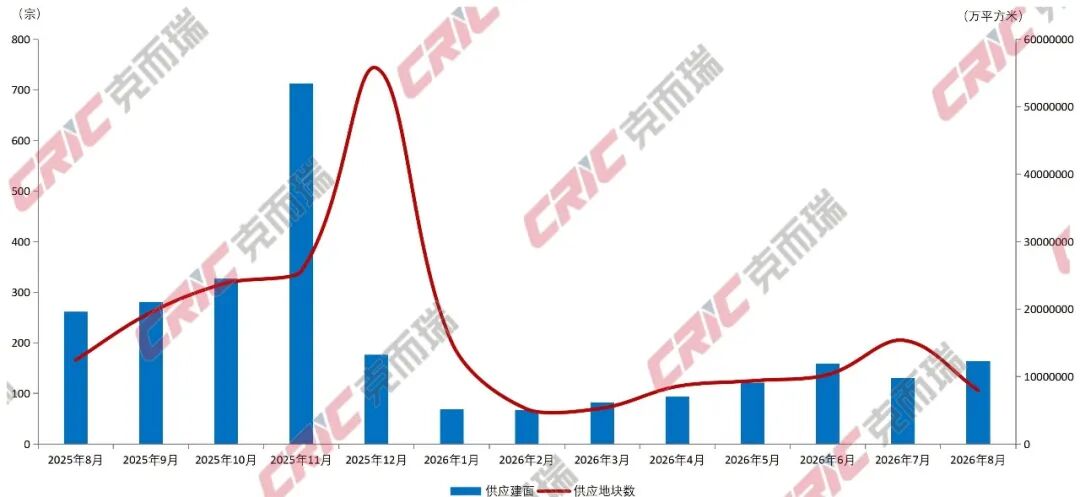
Figure 1 Monthly supply of residential land in 50 key cities from August 2025 to August 2026
In terms of transactions, in August 2026, the scale of land transactions in the 50 key cities declined significantly. The total construction area of the transaction was about 6.030,800 square meters, down 32.4% year on year and 31.3% month on month; the total transaction price was about 75.01 billion yuan, up 28.8% year on year and 23.8% month on month; the average transaction price was about 12,446 yuan/square meter, up 90.4% year on year and 10.9% month on month. The average transaction price rebounded slightly month-on-month and rose sharply year-on-year, mainly affected by differences in transaction structures between cities and the increase in the share of high-value land plots in core cities — high-value land transactions in core cities such as Beijing and Shanghai supported the overall average price in the same month. Among them, Shanghai Zhenruzhixin collected about 15.02 billion yuan for a single parcel of land.
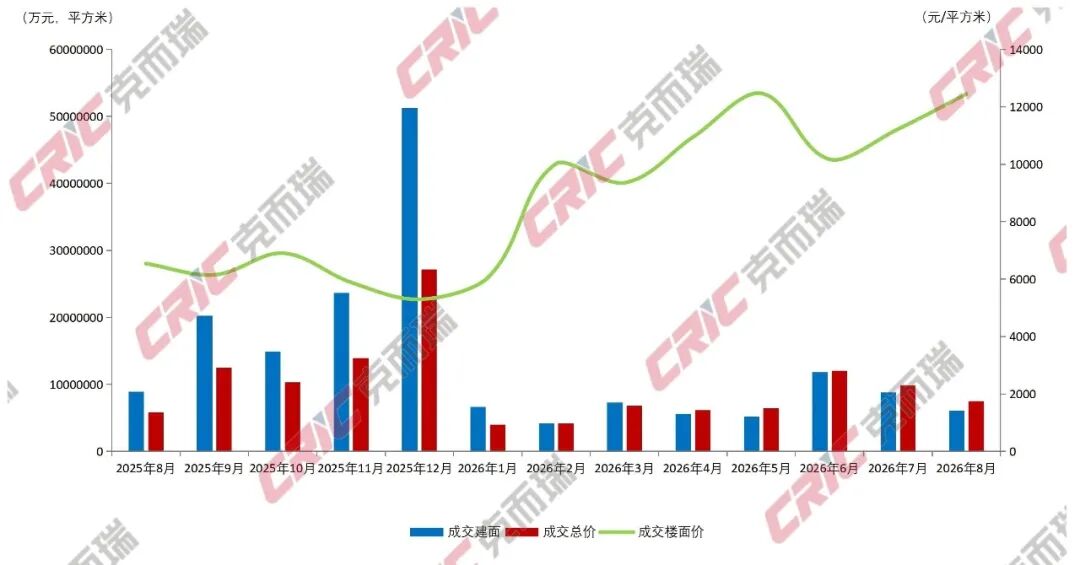
Figure 2 Monthly residential land transactions in 50 key cities from August 2025 to August 2026
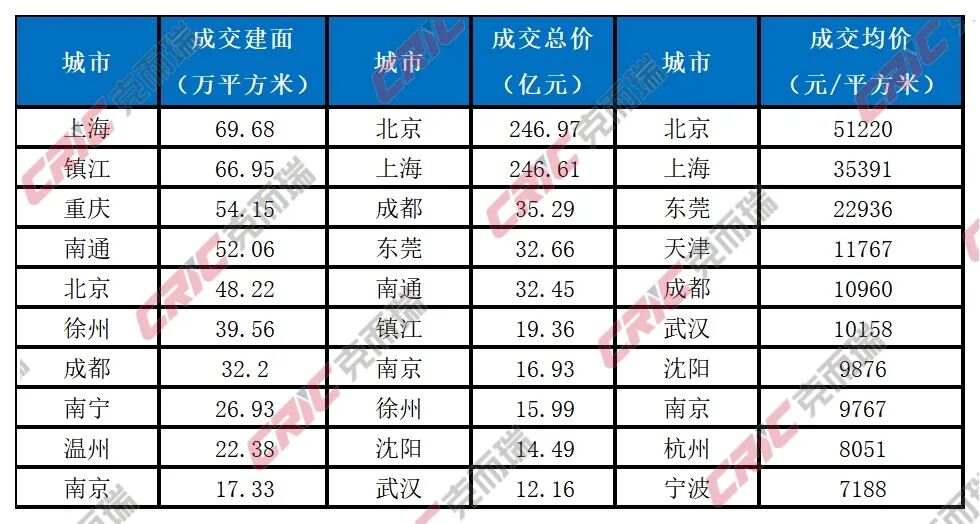
Judging from the city's performance, in terms of construction, Shanghai ranked first with 696,800 square meters, while Zhenjiang, Chongqing, Nantong, and Beijing ranked second to fifth. Chengdu, Nanning, Wenzhou, and Nanjing also ranked among the top. Among the third- and fourth-tier cities, Zhenjiang, Nantong, and Xuzhou had significant transaction volume. In terms of total transaction price, Beijing took the lead with a total transaction price of about 24.697 billion yuan with a total transaction price of about 24.697 billion yuan, followed by Shanghai with 24.661 billion yuan, and the two were almost equal. Chengdu, Dongguan, and Nantong were separated, and the core city agglomeration effect was remarkable. In terms of average transaction price, Beijing ranked first with about 5,120 yuan/square meter, Shanghai ranked second with 35,391 yuan/square meter, and Dongguan, Tianjin, and Chengdu ranked in the top five. The value of high-quality land plots in core cities continues to stand out.
Table 1 Top 10 residential land transactions involving construction surface, total transaction price, and average transaction price in the 50 key cities in August 2026
The premium rate fell to the single-digit range, and the streaming rate rebounded slightly
In August 2026, the average land premium rate in the 50 cities was 7.68%, down 7.25 percentage points from 14.93% in July, and still 1.51 percentage points higher than 6.17% in August 2025. High-quality plots in core cities can still be sold at a certain premium, but the number of high-premium plots has been further reduced, and market bids are becoming more cautious.
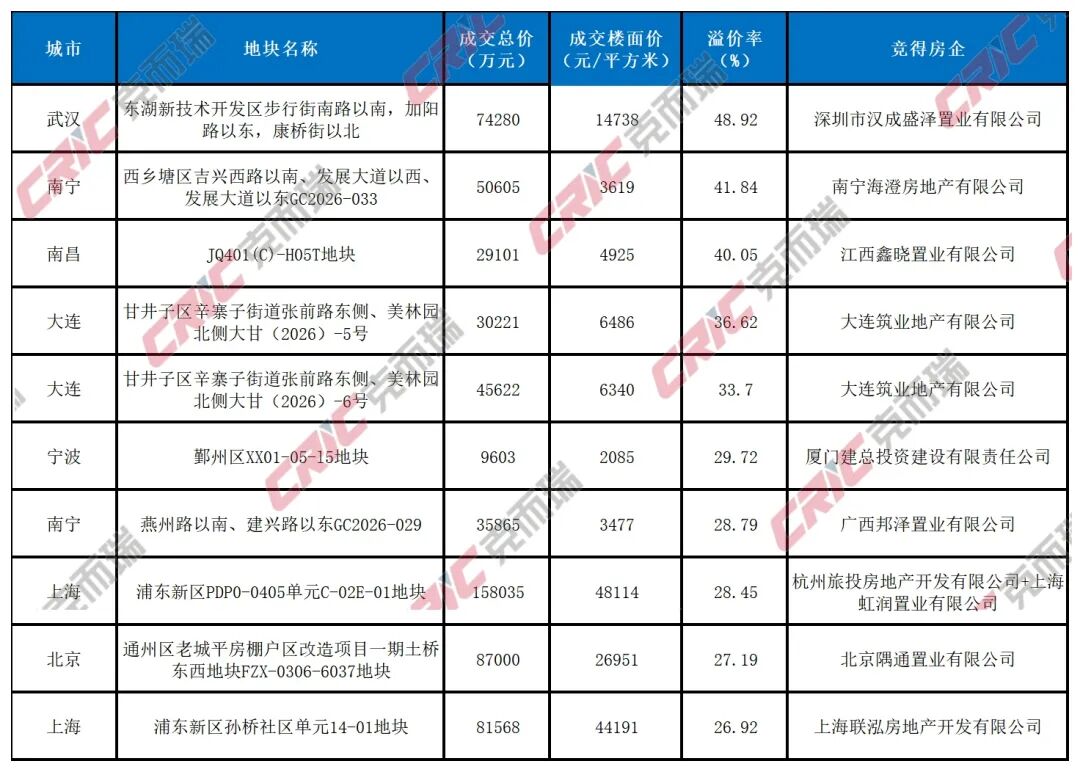
Looking at specific plots, the plot with the highest premium rate in August came from plot P (2026) 063 in Wuhan Donghu New Technology Development Zone, with a premium rate of 48.92%; the premium rate for GC2026-033 plot in Xixiangtang District of Nanning was 41.84%, the premium rate for DAGJ2026008 in the Nanchang High-tech Zone was 40.05%, and the premium rate for the two parcels in Ganjingzi District of Dalian reached 36.62% and 33.70% respectively. Compared with July, land plots with ultra-high premiums (with a premium rate of more than 50%) basically disappeared in August, and market popularity further returned to a rational range.
Overall, the premium rate level continued to decline in August. The average premium rate fell to the single-digit range, but high-quality land in core cities was still able to maintain a certain premium level, indicating that housing enterprises are still willing to compete for high-quality assets with strong certainty, but bids are becoming more cautious, and the market popularity center is lower than in the first half of the year.
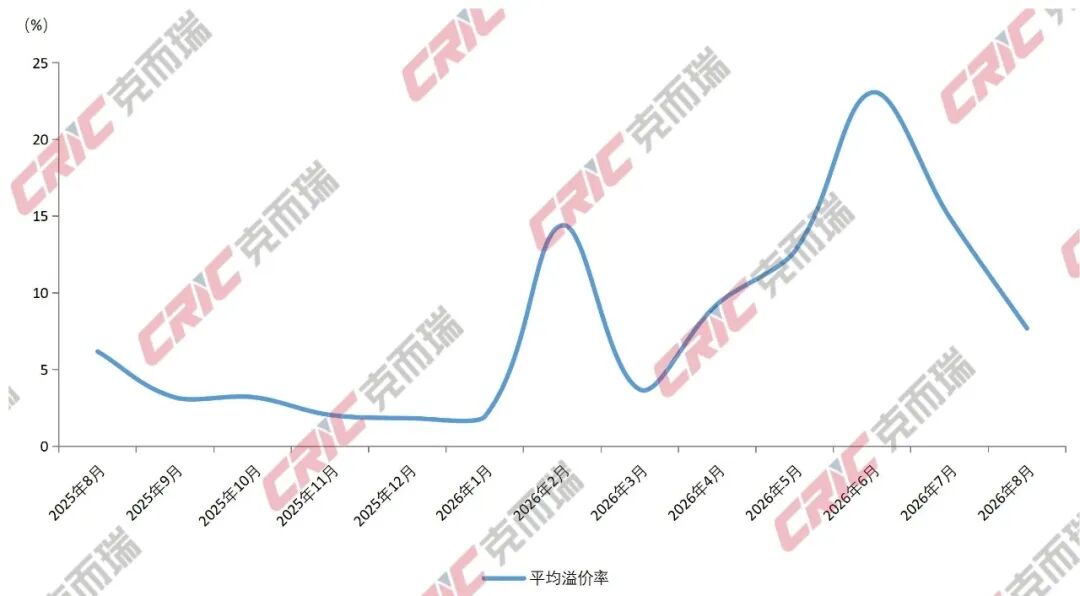
Figure 3 Monthly trend of average premium rates for residential land transactions in 50 key cities from August 2025 to August 2026
The land auction rate in August was 3.77%, up from 1.95% in July, but it is still at a relatively low level since the deep adjustment of real estate; down 1.65 percentage points from 5.42% in the same period last year. Streamlined plots are mainly concentrated in third- and fourth-tier cities. Basically, all high-quality plots in core cities have been successfully sold, and the pattern of market differentiation continues.
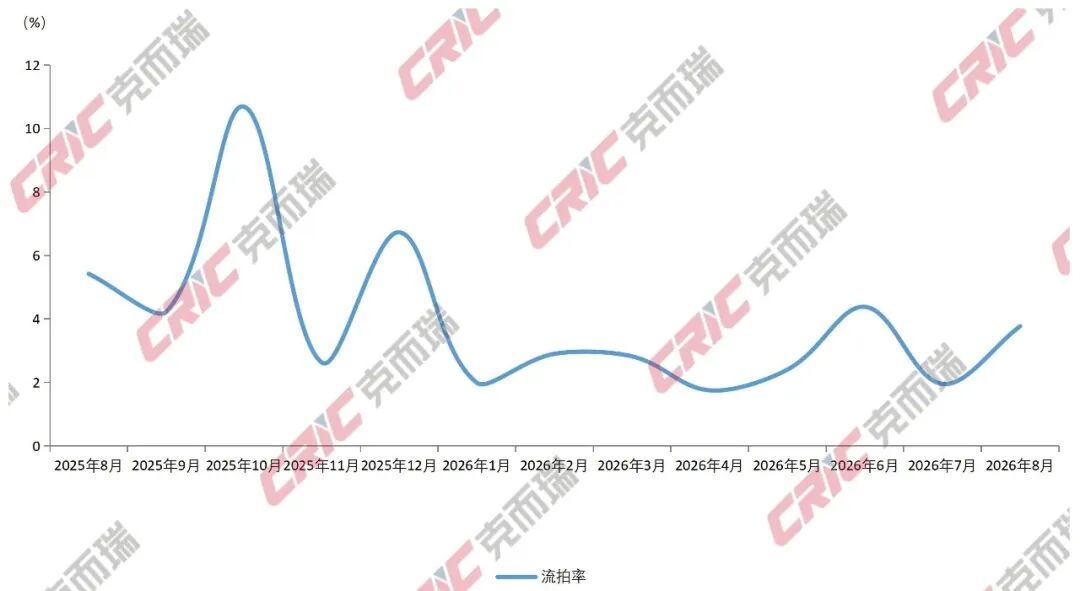
Figure 4 Monthly trend of residential land flow rate in 50 key cities from August 2025 to August 2026
Shanghai and Beijing lead the total price list and unit price list respectively, while Wuhan and Nanning rank among the highest premium rates
Judging from the three dimensions of total price, unit price, and premium rate, the popularity of the land market in August was highly concentrated in core cities such as Beijing and Shanghai. Among the first-tier cities, Beijing and Shanghai showed outstanding performance; among second-tier cities, Chengdu, Dongguan, and Wuhan were also shortlisted for high-quality land.
In terms of total price TOP10, the Zhenruzhixin plot (W060802 unit B03B-01, B04B-01, B06-01 plot) in Putuo District of Shanghai was contested by Zhonghai at a base price of 15.019 billion yuan, with a comprehensive floor price of about 37,835 yuan/square meter (about 68,000 yuan/square meter for the residential part), leading the total price list; the surrounding area of Xijiao Airport in Sijiqing Town, Haidian District, Beijing (Xiran, Tiancun, Changqing area) urban village renovation project ranked second with 9.761 billion yuan; The Guangqu Road plot ranked third with 8.399 billion yuan; The land plot in the North Bund area of Hongkou District of Shanghai ranked fourth with 3.845 billion yuan. Among the TOP10, Beijing accounts for 4 cases, Shanghai accounts for 4 cases, and Chengdu and Nanjing each account for 1 case. First-tier cities have absolute dominance.
In terms of unit price TOP10, the Guangqu Road plot in Nanmofang Township, Chaoyang District, Beijing climbed to the top with a floor price of 8,147 yuan/square meter; the Sijiqing Town plot in Haidian District of Beijing ranked second with 68,444 yuan/square meter; the C-02E-01 plot in Shanghai's Pudong New Area ranked third with 48,114 yuan/square meter; Zhenruzhixin in Shanghai ranked sixth with a transaction floor price of 37,835 yuan/square meter. Of the top ten land plots in unit prices, Beijing accounts for 5 cases and Shanghai accounts for 5. The value of high-end land plots in first-tier cities continues to be recognized by the market.
In terms of the top 10 premium rates, plot P (2026) 063 of Wuhan Donghu New Technology Development Zone ranked first with 48.92%, plot GC2026-033 in Xixiangtang District of Nanning ranked second with 41.84%, and DAGJ2026008 in Nanchang High-tech Zone ranked third with 40.05%; the two parcels of land in Dalian ranked fourth and fifth. The distribution of cities on the August premium rate list was more scattered. Cities such as Wuhan, Nanning, Nanchang, and Dalian experienced high premiums due to scarce land supply in the region, but the overall premium level dropped significantly from July.
Taken together, the keywords for the August land market were “decline and differentiation” — Beijing and Shanghai had outstanding performance in the total price and unit price lists; cities such as Wuhan, Nanning, Nanchang, and Dalian showed individual high-premium plots due to local land supply shortages, but this did not change the characteristics of the overall market decline in popularity and structural differentiation. The long-term logic of “high-quality assets in core cities being sought after” in the land market has not changed, yet short-term popularity still shows clear monthly fluctuations due to the pace of land supply and the financial aspects of housing enterprises.
Table 2 Top 10 total residential land transaction prices in the 50 key cities in August 2026
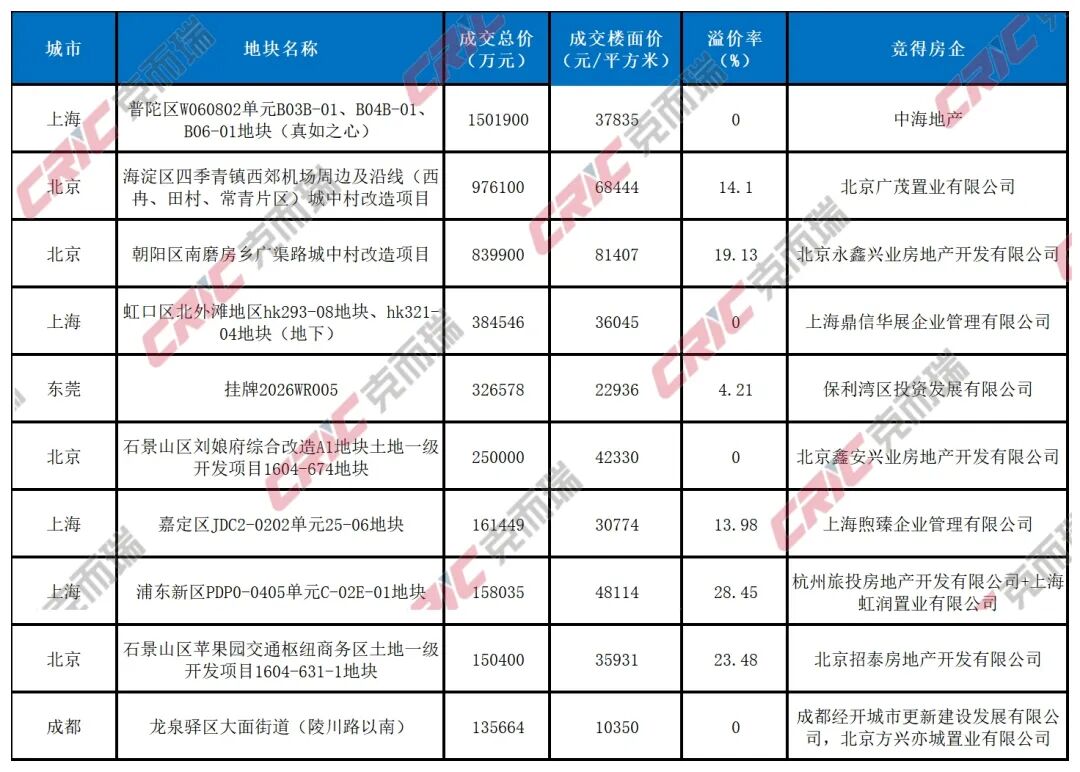
Table 3 Top 10 transaction unit prices for residential land in the 50 key cities in August 2026
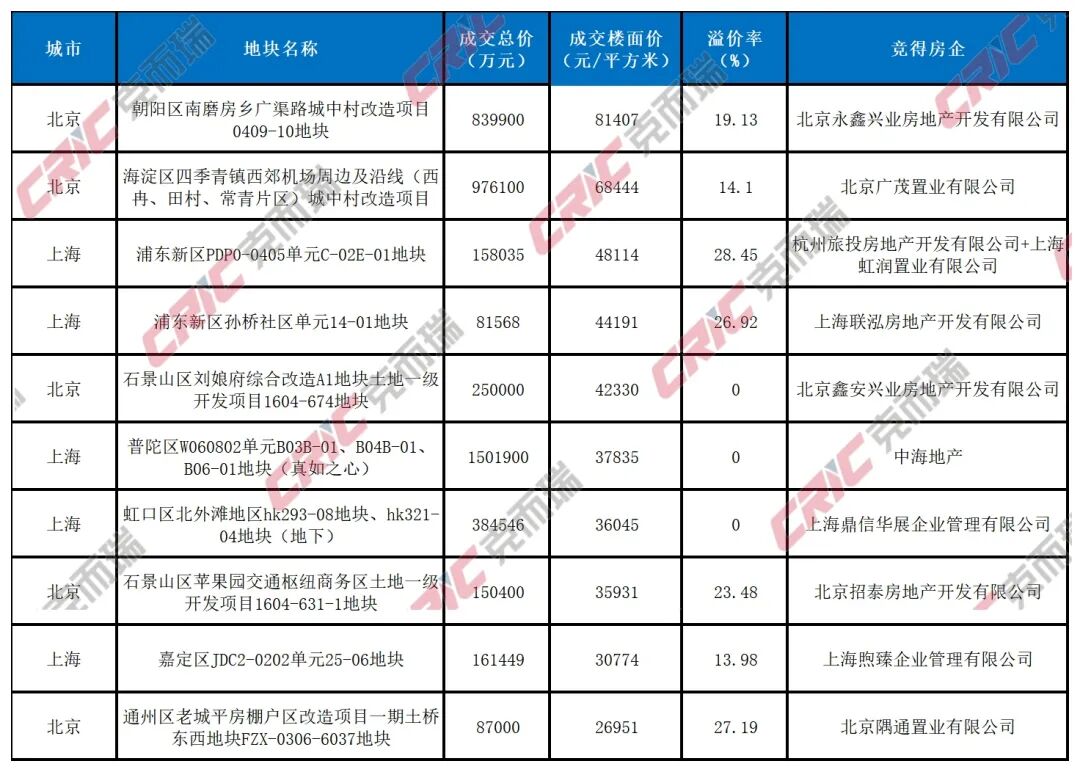 Table 4 Top 10 premium rates for residential land transactions in 50 key cities in August 2026