
- PRICING
- LIVE QUOTES
- LEARN
- HELP


EN
3 Dividend Stocks To Consider For Your Portfolio
In the last week, the United States market has stayed flat, yet over the past 12 months, it has risen by 18%, with earnings forecasted to grow by 17% annually. In such a dynamic environment, dividend stocks can offer a blend of stability and income potential that may complement an investor's portfolio.
Top 10 Dividend Stocks In The United States
| Name | Dividend Yield | Dividend Rating |
| Peoples Bancorp (PEBO) | 4.24% | ★★★★★☆ |
| OTC Markets Group (OTCM) | 5.29% | ★★★★★★ |
| Huntington Bancshares (HBAN) | 3.66% | ★★★★★☆ |
| Host Hotels & Resorts (HST) | 4.26% | ★★★★★☆ |
| First Interstate BancSystem (FIBK) | 5.08% | ★★★★★★ |
| Ennis (EBF) | 4.65% | ★★★★★★ |
| Credicorp (BAP) | 4.05% | ★★★★★☆ |
| Columbia Banking System (COLB) | 4.92% | ★★★★★★ |
| Coca-Cola FEMSA. de (KOF) | 4.04% | ★★★★★★ |
| Bladex (BLX) | 5.04% | ★★★★★☆ |
Click here to see the full list of 95 stocks from our Top US Dividend Stocks screener.
We're going to check out a few of the best picks from our screener tool.
Weibo (WB)
Simply Wall St Dividend Rating: ★★★★☆☆
Overview: Weibo Corporation operates as a social media platform in the People’s Republic of China, enabling users to create, discover, and distribute content, with a market cap of approximately $1.72 billion.
Operations: Weibo Corporation generates its revenue primarily from Advertising and Marketing, which accounts for $1.53 billion, and Value-Added Services, contributing $260.81 million.
Dividend Yield: 8.7%
Weibo's dividend payments are well-supported by earnings and cash flows, with payout ratios of 38.7% and 31.4%, respectively. Despite a recent decline in net income to US$67.38 million for Q2 2026, its dividend yield remains competitive at 8.73%. However, as dividends were recently initiated, their stability and growth potential remain uncertain. Trading at a significant discount to estimated fair value suggests potential upside relative to peers and industry benchmarks.
- Delve into the full analysis dividend report here for a deeper understanding of Weibo.
- Insights from our recent valuation report point to the potential undervaluation of Weibo shares in the market.

Compañía de Minas BuenaventuraA (BVN)
Simply Wall St Dividend Rating: ★★★★☆☆
Overview: Compañía de Minas Buenaventura S.A.A., along with its subsidiaries, is involved in the exploration, development, construction, and operation of mines across Peru, the Americas, Europe, and Asia with a market cap of $8.92 billion.
Operations: Compañía de Minas Buenaventura S.A.A.'s revenue segments include Mining Operation - Uchucchacua at $811.01 million, Participation in Investments - Sociedad Minera Cerro Verde S.A.A at $5.48 billion, Mining Operation - Colquijirca at $658.11 million, Participation in Investments - Compañía Minera Coimolache S.A. at $374.19 million, Mining Operation - Orcopampa at $249.45 million, Mining Operation - Tambomayo at $146.47 million, Mining Operation - Julcani at $109.26 million, Industrial Activities generating $91.94 million, Energy Generation and Transmission contributing $38.03 million, and Mining Operation - La Zanja with revenues of $76.31 million.
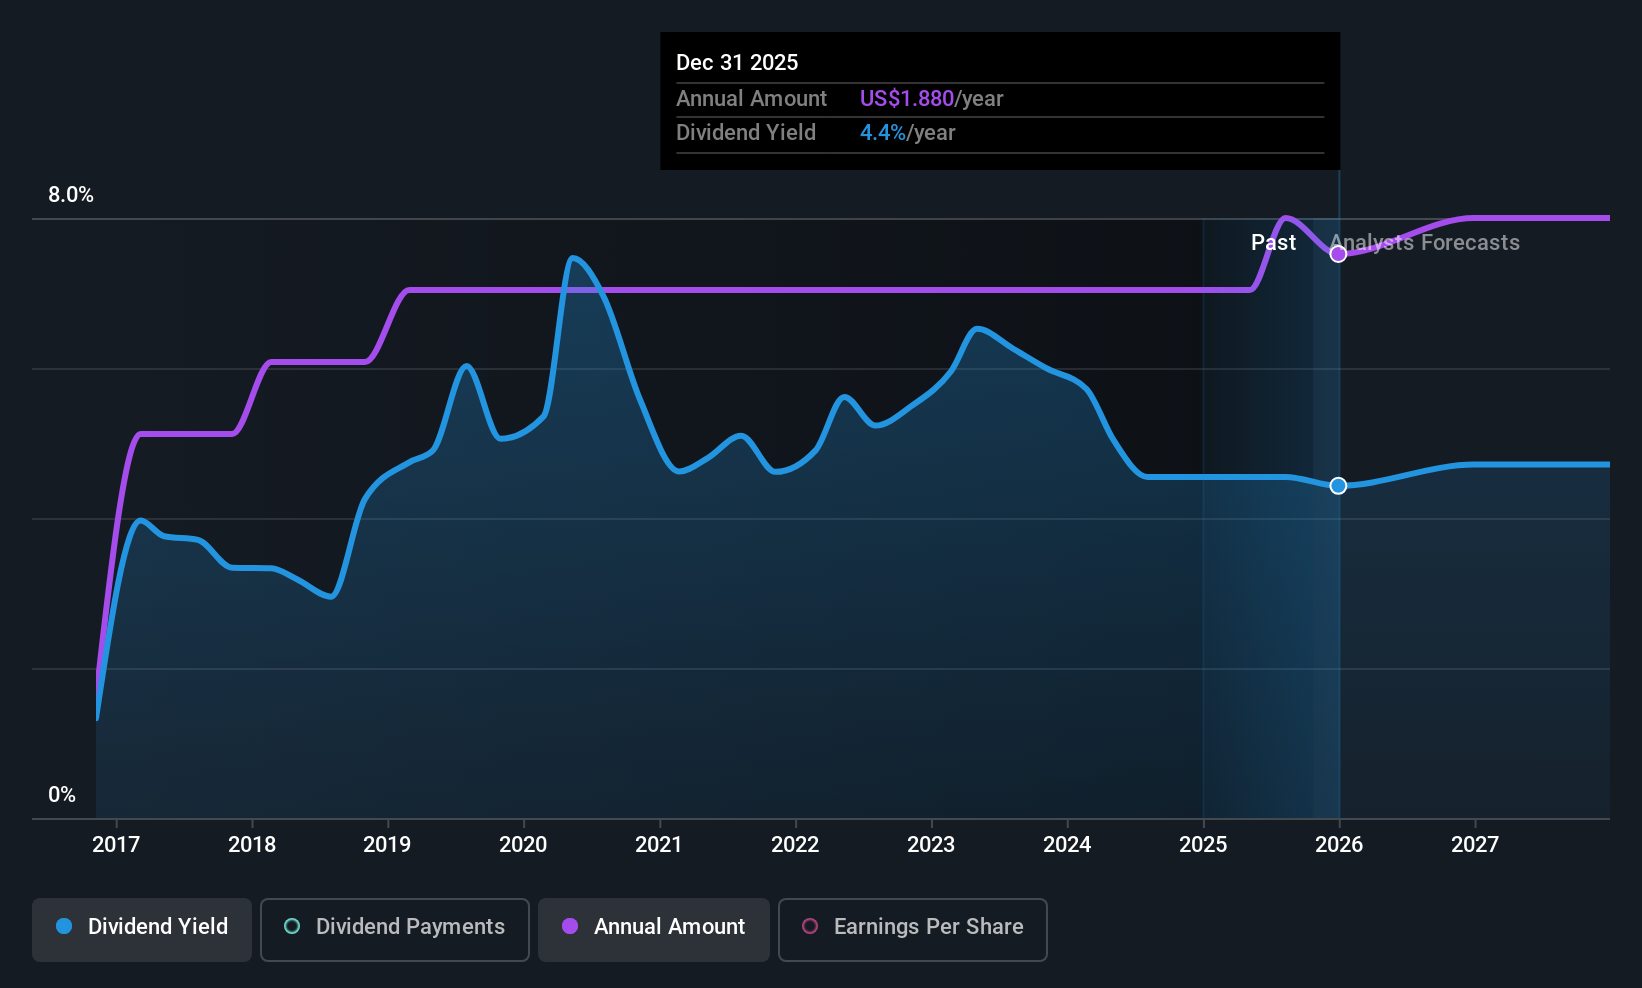
Dividend Yield: 3.2%
Compañía de Minas Buenaventura's dividend sustainability is supported by a low payout ratio of 26.9% and a cash payout ratio of 43.9%, indicating strong coverage by earnings and cash flows. Despite its dividend yield being lower than the top US payers, it trades at an attractive valuation with a P/E ratio of 8.3x compared to the market average. However, its dividend history has been volatile over the past decade, raising concerns about reliability despite recent profit growth.
- Click here and access our complete dividend analysis report to understand the dynamics of Compañía de Minas BuenaventuraA.
- According our valuation report, there's an indication that Compañía de Minas BuenaventuraA's share price might be on the cheaper side.
Bank of N.T. Butterfield & Son (NTB)
Simply Wall St Dividend Rating: ★★★★☆☆
Overview: The Bank of N.T. Butterfield & Son Limited offers community, commercial, and private banking services to individuals and small to medium-sized businesses, with a market cap of $2.33 billion.
Operations: The Bank of N.T. Butterfield & Son Limited generates revenue primarily from its banking segment, totaling $625.16 million.
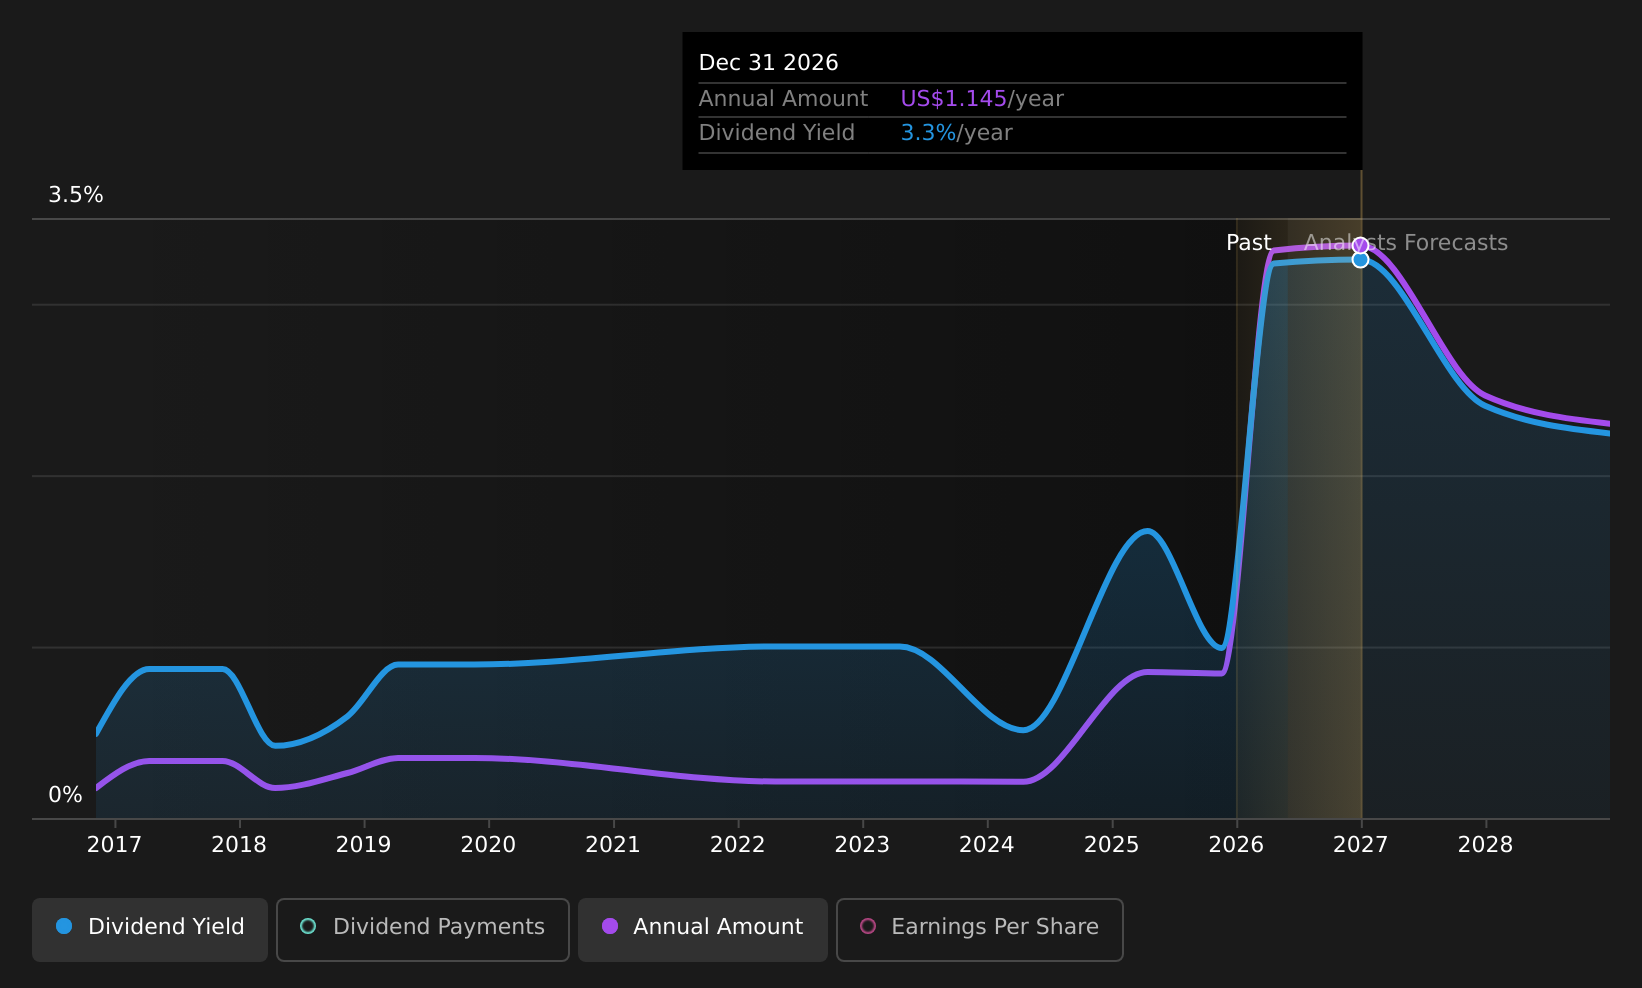
Dividend Yield: 3.4%
Bank of N.T. Butterfield & Son's dividends are well-covered with a low payout ratio of 34.2% and have been stable over the past decade, though its yield of 3.37% is below the top US payers. Despite recent insider selling, it trades at a significant discount to estimated fair value and has shown consistent earnings growth, although concerns arise from high bad loans at 3.3%. Recent earnings showed mixed results with increased net interest income but decreased quarterly net income year-over-year.
- Dive into the specifics of Bank of N.T. Butterfield & Son here with our thorough dividend report.
- The valuation report we've compiled suggests that Bank of N.T. Butterfield & Son's current price could be quite moderate.
Key Takeaways
- Click through to start exploring the rest of the 92 Top US Dividend Stocks now.
- Have you diversified into these companies? Leverage the power of Simply Wall St's portfolio to keep a close eye on market movements affecting your investments.
- Maximize your investment potential with Simply Wall St, the comprehensive app that offers global market insights for free.
Interested In Other Possibilities?
- Explore high-performing small cap companies that haven't yet garnered significant analyst attention.
- Fuel your portfolio with companies showing strong growth potential, backed by optimistic outlooks both from analysts and management.
- Find companies with promising cash flow potential yet trading below their fair value.
This article by Simply Wall St is general in nature. We provide commentary based on historical data and analyst forecasts only using an unbiased methodology and our articles are not intended to be financial advice. It does not constitute a recommendation to buy or sell any stock, and does not take account of your objectives, or your financial situation. We aim to bring you long-term focused analysis driven by fundamental data. Note that our analysis may not factor in the latest price-sensitive company announcements or qualitative material. Simply Wall St has no position in any stocks mentioned.
Have feedback on this article? Concerned about the content? Get in touch with us directly. Alternatively, email editorial-team@simplywallst.com