
- PRICING
- LIVE QUOTES
- LEARN
- HELP


EN
Broadcom (AVGO) Stock Looks Fully Priced Despite Cash Flow Upside
Broadcom stock has delivered a very large 5 year gain, yet current valuation checks send a mixed message, with the Discounted Cash Flow (DCF) estimate pointing to some undervaluation while market multiples look closer to fair value.
- Over the past 5 years Broadcom has returned about 6.9x, which puts recent pullbacks into context and encourages investors to ask whether the stock is already pricing in a lot of good news.
- Custom AI chip demand and data center spending can support the cash flow outlook, while heavy planned debt financing for AI infrastructure and rising credit risk may constrain how much investors are willing to pay for that growth.
- On Simply Wall St’s broader checks, Broadcom earns a value score of 3 out of 6, which points to a mixed picture rather than a clear bargain or clear overvaluation.
The issue now is whether Broadcom’s current share price already reflects the intrinsic value indicated by the DCF work, or if the recent sell off and credit concerns have opened up a valuation gap.
Compare Broadcom's mixed valuation signal with other AI infrastructure stocks that analysts have filtered into the 55 AI infrastructure stocks.
Is Broadcom a Bargain on Cash Flow?
The Discounted Cash Flow (DCF) model estimates Broadcom’s worth based on the cash it is expected to generate for shareholders. For Broadcom, the model uses latest twelve month free cash flow of about $32.8b and assumes those cash flows keep growing rather than shrinking. On that basis, the DCF points to an intrinsic value of about $416 per share in $.
That estimate sits above the current share price, which implies the stock trades at roughly a 14.6% discount to this intrinsic value. Because recent news highlights Broadcom’s plan to raise up to $100b of debt to support AI chip expansion, the heavier balance sheet may help explain why the market is hesitating to fully reflect the DCF estimate in the price today.
Putting this together, the DCF work suggests Broadcom stock appears undervalued relative to its projected cash flows.
Our Discounted Cash Flow (DCF) analysis suggests Broadcom is undervalued by 14.6%. Track this in your watchlist or portfolio, or discover 51 more high quality undervalued stocks.

Does Broadcom Look Fairly Valued on Earnings?
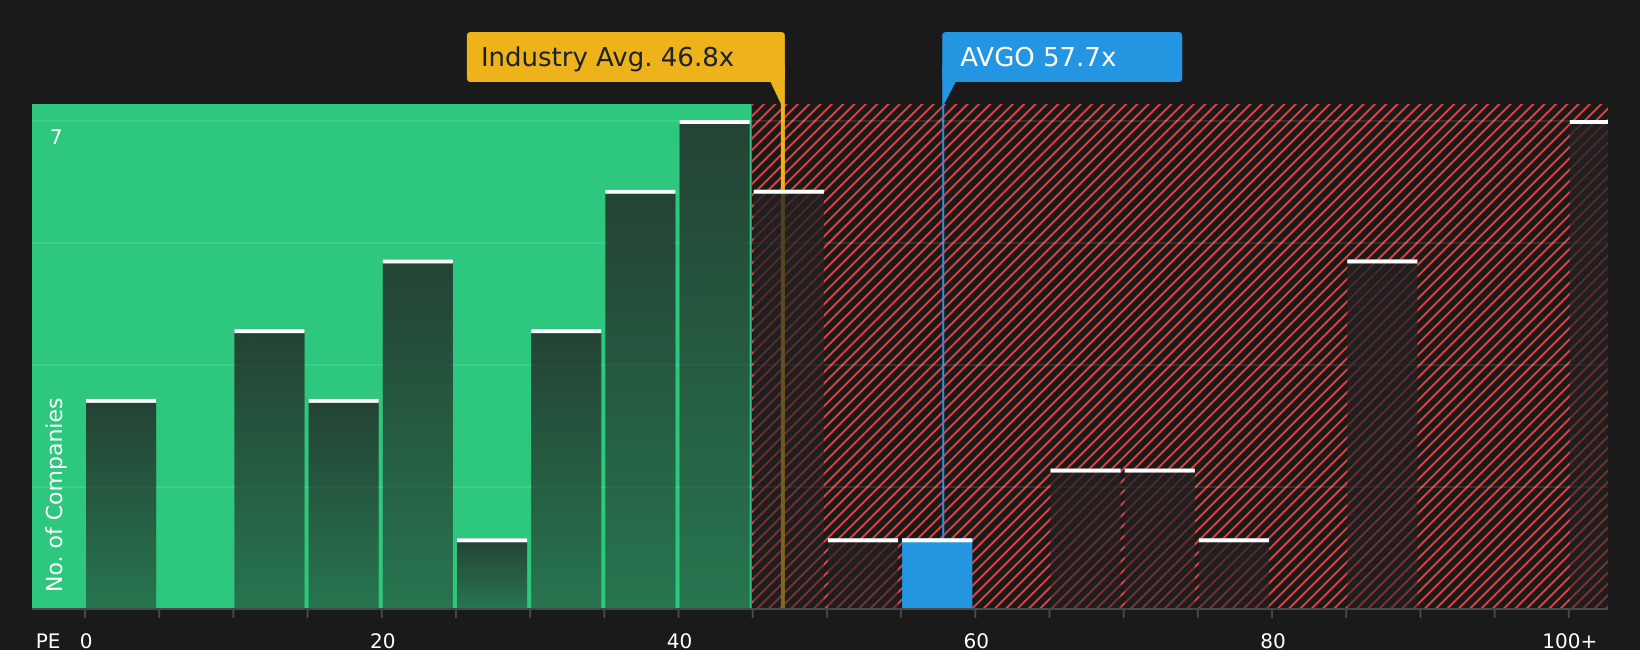
The P/E ratio is a useful check for Broadcom because earnings are a key focus for many investors looking at mature, cash generative chip companies. Broadcom currently trades on a P/E of about 57.7x, which is above the semiconductor industry average of 46.8x but below a peer group average of 64.8x. That positions the stock between broader sector pricing and a tighter set of higher rated peers.
Simply Wall St’s model suggests a Fair P/E Ratio of about 52.9x for Broadcom once growth, margins, size and risk are taken into account. That is modestly below the current 57.7x level, which points to a small premium rather than a wide gap. This is consistent with recent fund manager activity that highlights elevated expectations rather than an obvious mispricing.
Overall, Broadcom appears priced roughly in line with what the P/E framework suggests is fair, rather than clearly cheap or clearly expensive on earnings.
See what the numbers say about this price — find out in our valuation breakdown.
The Broadcom Narrative: What Would Justify Today's Price?
Simply Wall St Narratives pick up where Broadcom's mixed DCF and P/E signals leave you. They spell out which assumptions about Broadcom's future growth, margins and earnings would need to hold for the stock to be worth meaningfully more or less than today's price on the Community page. Each one sets out fair value as a thesis about how the business might develop so you can see how that view plays out over time, rather than treating value as a single static number.
Community views on Broadcom are sharply split, with some investors framing it as critical digital infrastructure and others arguing the numbers still look too rich.
Bull case: 45% undervalued
"Broadcom provides essential infrastructure for the digital economy, whether data is generated by AI models, cloud applications, enterprise software, autonomous systems, or future technologies that do not yet exist…”
Read the full Bull Case to see why Broadcom could be undervalued
Bear case: 37% overvalued
"Given the fact that its current market price is well above P90, we can extrapolate that there is more than 90% probability that the stock is overvalued at the current prices…”
Read the full Bear Case to see why Broadcom could be overvalued
Do you think there's more to the story for Broadcom? Head over to our Community to see what others are saying!
The Bottom Line
Broadcom’s Discounted Cash Flow (DCF) work points to some undervaluation, while the current P/E suggests the stock is priced about right compared with peers. That gap mainly reflects how the intrinsic value model leans on future cash flows, whereas the market multiple view leans on near term growth expectations and sentiment after a very large share price move. With broader valuation checks sitting in a mixed range, the key question is whether Broadcom’s AI driven cash flow can develop strongly enough to justify both the higher earnings multiple and the heavier balance sheet required to fund that build out.
This article by Simply Wall St is general in nature. We provide commentary based on historical data and analyst forecasts only using an unbiased methodology and our articles are not intended to be financial advice. It does not constitute a recommendation to buy or sell any stock, and does not take account of your objectives, or your financial situation. We aim to bring you long-term focused analysis driven by fundamental data. Note that our analysis may not factor in the latest price-sensitive company announcements or qualitative material. Simply Wall St has no position in any stocks mentioned.
Have feedback on this article? Concerned about the content? Get in touch with us directly. Alternatively, email editorial-team@simplywallst.com