
- PRICING
- LIVE QUOTES
- LEARN
- HELP


EN
3 Asian Stocks Estimated To Be 19% To 35.6% Below Intrinsic Value
As Asian markets navigate a complex landscape marked by geopolitical tensions, fluctuating oil prices, and varying economic data from key regions like China and Japan, investors are increasingly seeking opportunities that may be undervalued amidst this volatility. Identifying stocks that are trading below their intrinsic value can offer potential for growth, especially in an environment where market sentiment is influenced by broader macroeconomic factors.
Top 10 Undervalued Stocks Based On Cash Flows In Asia
| Name | Current Price | Fair Value (Est) | Discount (Est) |
| uSonar (TSE:431A) | ¥2275.00 | ¥4419.63 | 48.5% |
| SILICON2 (KOSDAQ:A257720) | ₩51800.00 | ₩103326.49 | 49.9% |
| Shiyue Daotian Group (SEHK:9676) | HK$4.625 | HK$9.20 | 49.7% |
| Shengda ResourcesLtd (SZSE:000603) | CN¥37.16 | CN¥73.24 | 49.3% |
| Sansha Electric ManufacturingLtd (TSE:6882) | ¥1191.00 | ¥2322.15 | 48.7% |
| Karmarts (SET:KAMART) | THB6.85 | THB13.36 | 48.7% |
| HyVision System (KOSDAQ:A126700) | ₩11800.00 | ₩22946.05 | 48.6% |
| HUMAN MADE (TSE:456A) | ¥1678.00 | ¥3336.53 | 49.7% |
| gremsInc (TSE:3150) | ¥2545.00 | ¥4913.63 | 48.2% |
| CMTXLtd (KOSDAQ:A388210) | ₩73200.00 | ₩144926.67 | 49.5% |
Let's dive into some prime choices out of the screener.
Akeso (SEHK:9926)
Overview: Akeso, Inc. is a biopharmaceutical company involved in the research, development, manufacture, and commercialization of antibody drugs globally with a market cap of HK$86.77 billion.
Operations: The company generates revenue of CN¥3.06 billion from its activities in the research, development, production, and sale of biopharmaceutical products.
Estimated Discount To Fair Value: 35.6%
Akeso, Inc. appears undervalued based on cash flows, trading at HK$94.2, significantly below its estimated future cash flow value of HK$146.38. With forecasted revenue growth of 28.6% annually and earnings expected to grow by 46.03% per year, Akeso is poised for above-market performance in Hong Kong. Recent positive Phase III trial results for ivonescimab enhance its clinical profile and potential profitability within three years, contributing to its attractiveness as an investment opportunity in Asia's healthcare sector.
- Our earnings growth report unveils the potential for significant increases in Akeso's future results.
- Navigate through the intricacies of Akeso with our comprehensive financial health report here.

Shenzhen Megmeet Electrical (SZSE:002851)
Overview: Shenzhen Megmeet Electrical Co., LTD, with a market cap of CN¥71.61 billion, operates as an electrical automation company in China.
Operations: The company's revenue segments include Industrial Automation with CN¥1.25 billion, Power Electronics at CN¥2.34 billion, and Smart Home Appliances generating CN¥3.67 billion.
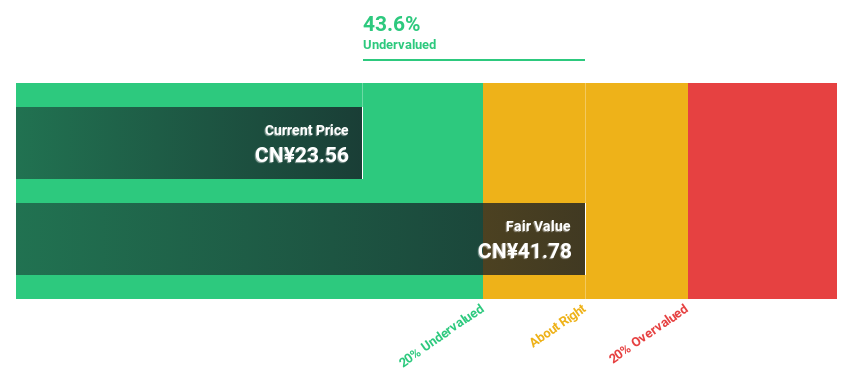
Estimated Discount To Fair Value: 28.2%
Shenzhen Megmeet Electrical is trading at CN¥123.11, notably below its estimated future cash flow value of CN¥171.43, suggesting it's undervalued based on cash flows. Despite recent volatility, earnings are forecast to grow by 67.68% annually over the next three years, outpacing the Chinese market average of 26%. However, profit margins have declined from 4.7% to 1.6%, and a recent dividend decrease may impact investor sentiment despite strong growth projections in revenue and earnings.
- In light of our recent growth report, it seems possible that Shenzhen Megmeet Electrical's financial performance will exceed current levels.
- Click here and access our complete balance sheet health report to understand the dynamics of Shenzhen Megmeet Electrical.
Furukawa Electric (TSE:5801)
Overview: Furukawa Electric Co., Ltd. operates globally across various sectors including Optical Solutions, Digital Infrastructure Components, Energy Infrastructure, Automotive Systems and Metal Solutions with a market cap of ¥2.75 trillion.
Operations: The company's revenue segments include Optical Solutions, Digital Infrastructure Components, Energy Infrastructure, Automotive Systems and Metal Solutions.
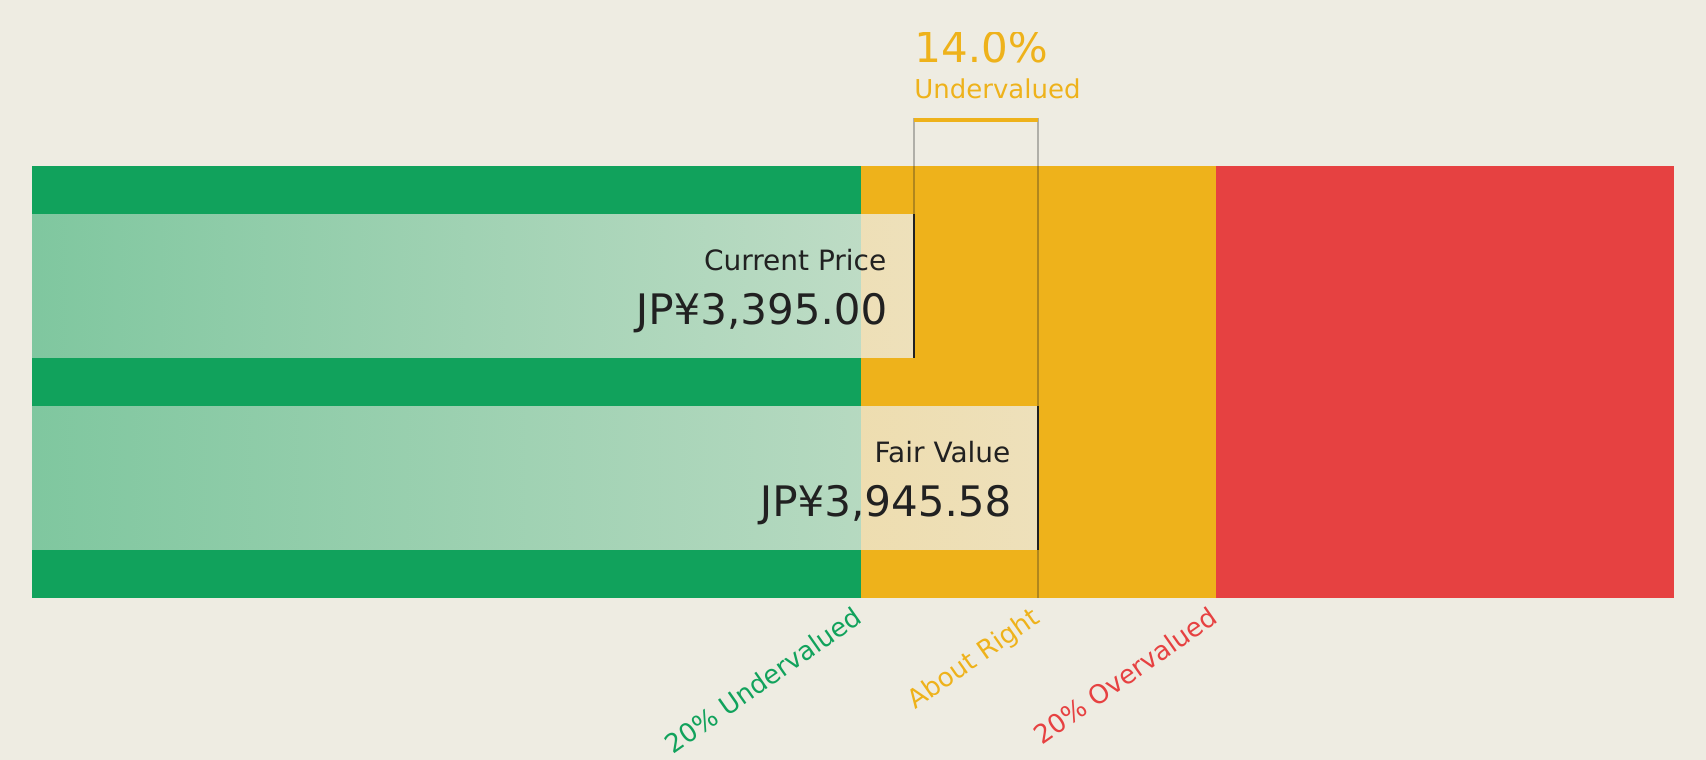
Estimated Discount To Fair Value: 19%
Furukawa Electric is trading at ¥3,905, below its estimated future cash flow value of ¥4,820.48. Earnings are projected to grow significantly at 20.8% annually over the next three years, surpassing Japan's market average of 8.9%. However, debt coverage by operating cash flow remains weak. Recent strategic alliances and business expansions in optical fiber production could bolster future revenues despite high share price volatility and large one-off items affecting financial results.
- According our earnings growth report, there's an indication that Furukawa Electric might be ready to expand.
- Click to explore a detailed breakdown of our findings in Furukawa Electric's balance sheet health report.
Summing It All Up
- Dive into all 219 of the Undervalued Asian Stocks Based On Cash Flows we have identified here.
- Are these companies part of your investment strategy? Use Simply Wall St to consolidate your holdings into a portfolio and gain insights with our comprehensive analysis tools.
- Invest smarter with the free Simply Wall St app providing detailed insights into every stock market around the globe.
Searching for a Fresh Perspective?
- Explore high-performing small cap companies that haven't yet garnered significant analyst attention.
- Diversify your portfolio with solid dividend payers offering reliable income streams to weather potential market turbulence.
- Fuel your portfolio with companies showing strong growth potential, backed by optimistic outlooks both from analysts and management.
This article by Simply Wall St is general in nature. We provide commentary based on historical data and analyst forecasts only using an unbiased methodology and our articles are not intended to be financial advice. It does not constitute a recommendation to buy or sell any stock, and does not take account of your objectives, or your financial situation. We aim to bring you long-term focused analysis driven by fundamental data. Note that our analysis may not factor in the latest price-sensitive company announcements or qualitative material. Simply Wall St has no position in any stocks mentioned.
Have feedback on this article? Concerned about the content? Get in touch with us directly. Alternatively, email editorial-team@simplywallst.com