
- PRICING
- LIVE QUOTES
- LEARN
- HELP


EN
PCI Technology Group Leads These 3 Asian Penny Stocks To Watch
As Asian markets navigate a landscape marked by economic fluctuations and evolving investor sentiment, penny stocks continue to capture attention for their unique investment potential. Despite being an older term, penny stocks—typically smaller or newer companies—offer intriguing opportunities for growth at accessible price points. When these stocks are backed by strong financials and solid fundamentals, they can present compelling prospects for investors seeking hidden gems in the market.
We're going to check out a few of the best picks from our screener tool.
PCI Technology Group (SHSE:600728)
Simply Wall St Financial Health Rating: ★★★★☆☆
Overview: PCI Technology Group Co., Ltd. and its subsidiaries offer software and information technology services in China, with a market capitalization of approximately CN¥9.89 billion.
Operations: The company generates revenue of CN¥10.13 billion from its software and IT services segment in China.
Market Cap: CN¥9.89B
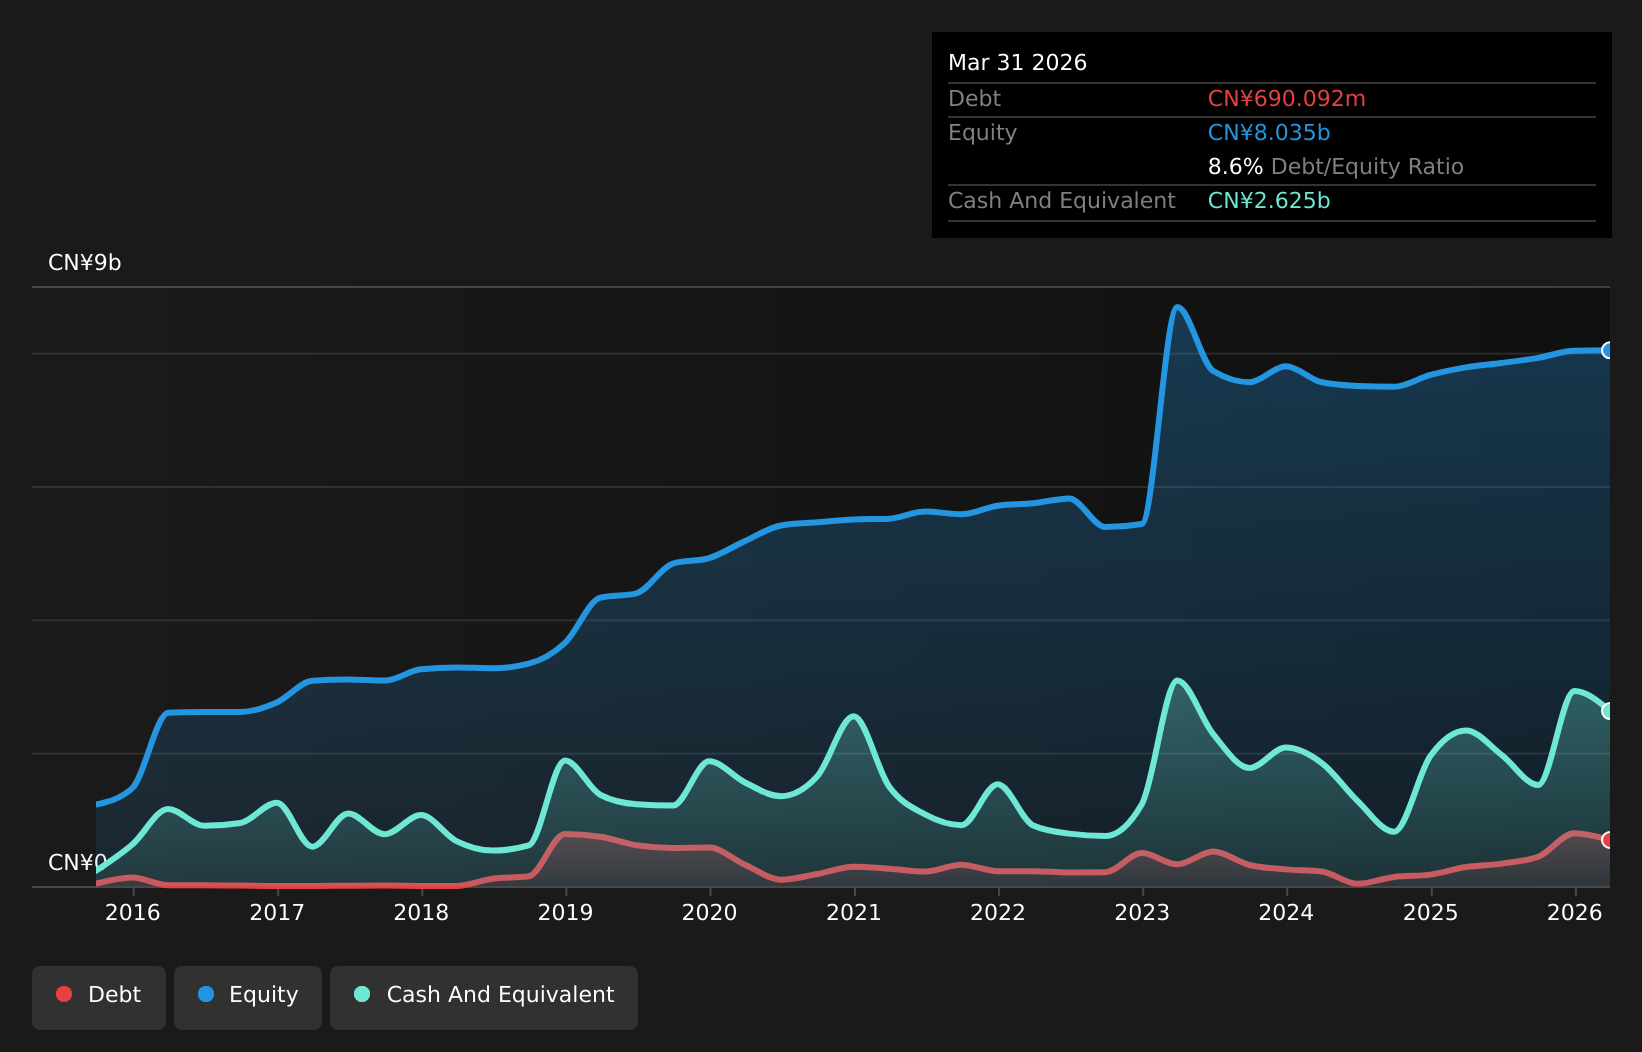
PCI Technology Group Co., Ltd. exhibits a mixed financial profile with short-term assets of CN¥11.4 billion surpassing both its long-term liabilities and short-term liabilities, indicating strong liquidity. However, earnings have declined by 14.8% annually over the past five years, and profit margins have decreased from 2.1% to 0.6%. Despite having more cash than total debt, the company's debt-to-equity ratio has increased over time, suggesting rising leverage concerns. The management team is relatively new but experienced with an average tenure of 2.3 years, which may impact strategic stability as they navigate these financial challenges in the competitive IT sector in China.
- Take a closer look at PCI Technology Group's potential here in our financial health report.
- Gain insights into PCI Technology Group's past trends and performance with our report on the company's historical track record.
Shenzhen Fenda Technology (SZSE:002681)
Simply Wall St Financial Health Rating: ★★★★★☆
Overview: Shenzhen Fenda Technology Co., Ltd. focuses on the research, design, production, and sales of consumer electronics devices and components across Asia, Europe, America, Africa, Oceania, and China with a market cap of CN¥8.11 billion.
Operations: No specific revenue segments have been reported for Shenzhen Fenda Technology Co., Ltd.
Market Cap: CN¥8.11B
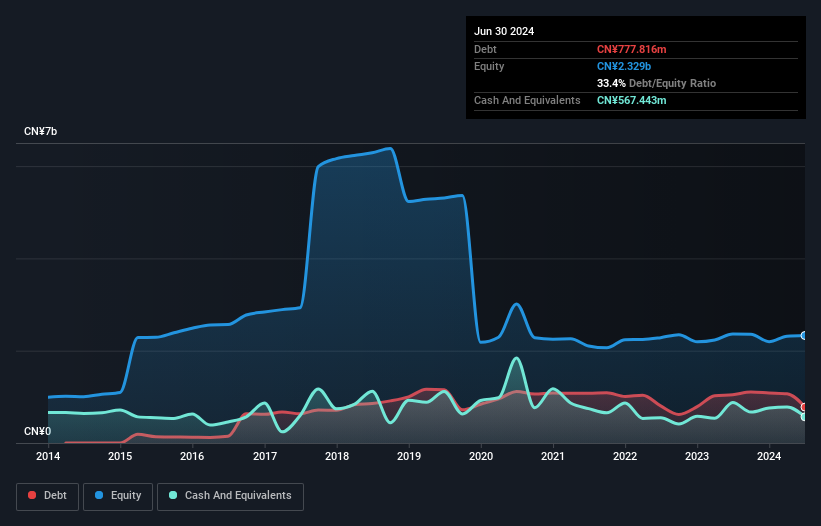
Shenzhen Fenda Technology Co., Ltd. presents a complex financial picture, with short-term assets of CN¥1.9 billion comfortably covering both short-term and long-term liabilities, indicating solid liquidity. Despite this, the company remains unprofitable with a negative return on equity of -6.67%, and earnings have consistently declined by 52.4% annually over the past five years. Positively, it has not diluted shareholders recently and maintains a satisfactory net debt-to-equity ratio of 25.7%. The experienced management team ensures strategic continuity, while its cash runway extends over three years thanks to positive free cash flow growth at 28.2% annually.
- Click to explore a detailed breakdown of our findings in Shenzhen Fenda Technology's financial health report.
- Learn about Shenzhen Fenda Technology's historical performance here.
Sumavision TechnologiesLtd (SZSE:300079)
Simply Wall St Financial Health Rating: ★★★★★★
Overview: Sumavision Technologies Co., Ltd., along with its subsidiaries, offers video delivery solutions both in China and internationally, with a market cap of CN¥6.48 billion.
Operations: Sumavision Technologies Co., Ltd. has not reported specific revenue segments, but it provides video delivery solutions within China and to international markets.
Market Cap: CN¥6.48B
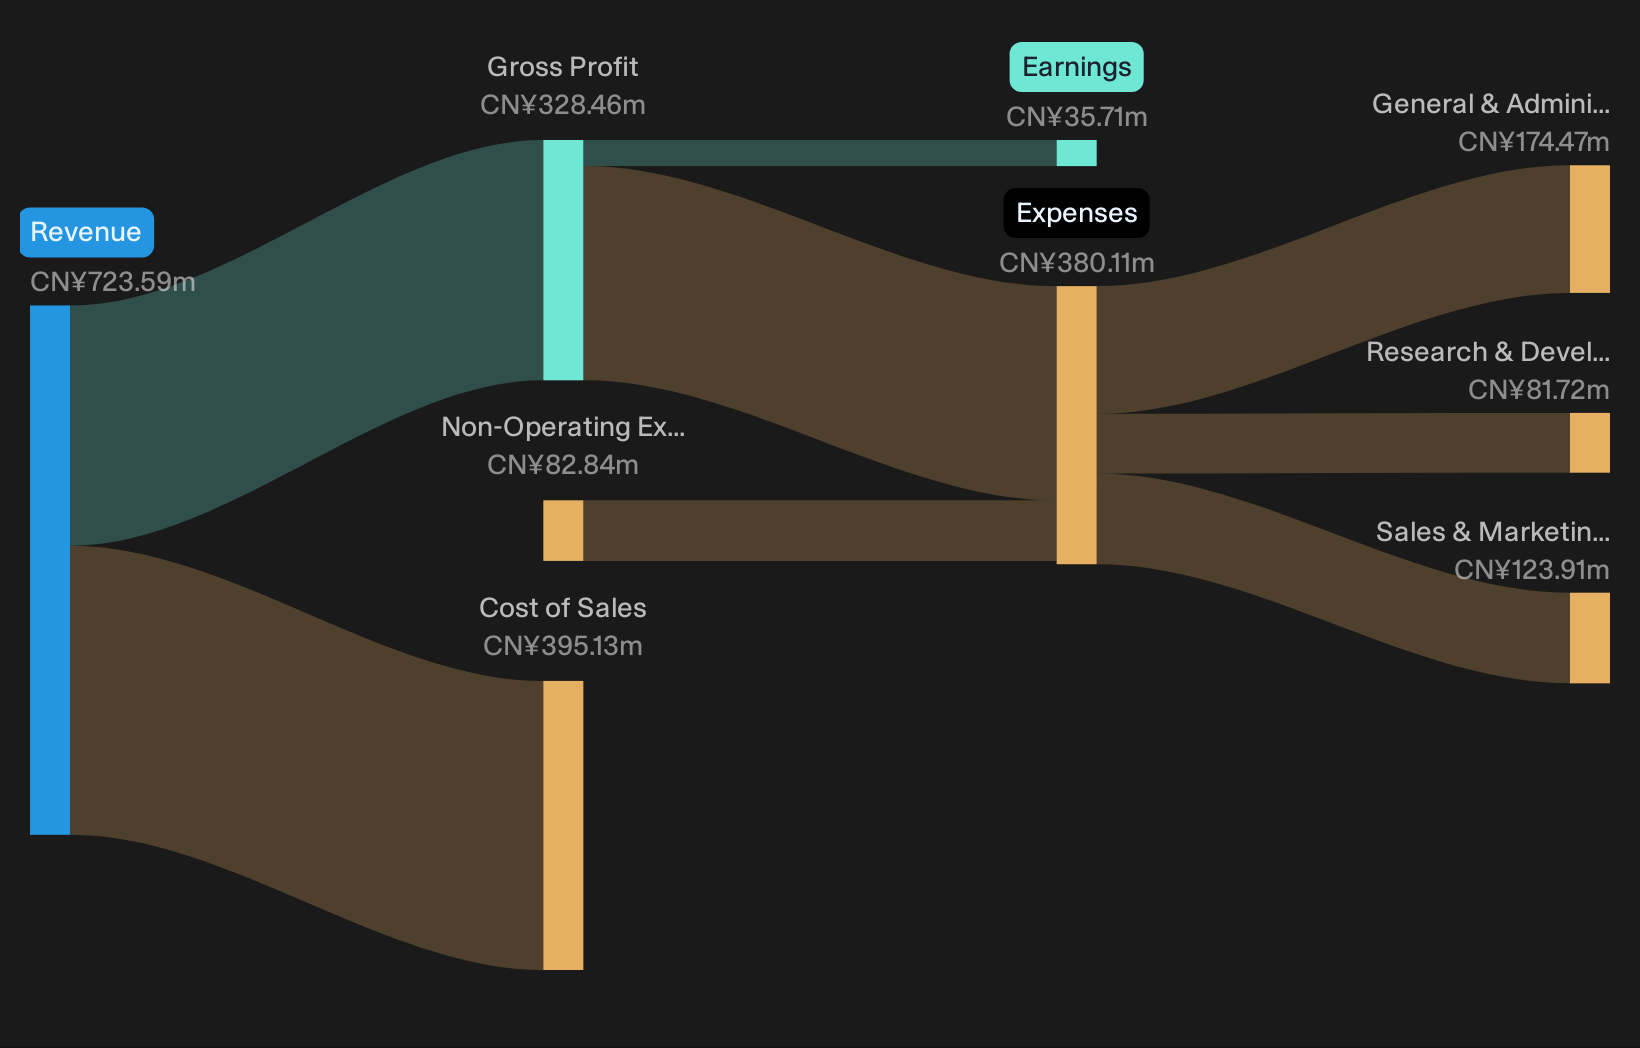
Sumavision Technologies Co., Ltd. offers a stable financial position with CN¥2.8 billion in short-term assets exceeding both its short and long-term liabilities, indicating strong liquidity. The company is debt-free, eliminating concerns over interest payments or debt coverage by cash flow. Recent earnings results show a modest increase in sales to CN¥276.33 million for the first half of 2026, up from CN¥264.85 million the previous year, alongside net income growth to CN¥22.69 million from CN¥16.7 million last year; however, profit margins have slightly declined to 5.3%. Despite these gains, earnings have decreased annually by 36.8% over five years and remain below industry averages with low return on equity at 0.9%. The management team is experienced with an average tenure of 6.1 years but faces challenges in reversing negative earnings trends amidst an unstable dividend track record and competitive market pressures.
- Click here to discover the nuances of Sumavision TechnologiesLtd with our detailed analytical financial health report.
- Evaluate Sumavision TechnologiesLtd's historical performance by accessing our past performance report.
Where To Now?
- Dive into all 1,039 of the Asian Penny Stocks we have identified here.
- Ready For A Different Approach? Uncover 18 companies that survived and thrived after COVID and have the right ingredients to survive Trump's tariffs.
This article by Simply Wall St is general in nature. We provide commentary based on historical data and analyst forecasts only using an unbiased methodology and our articles are not intended to be financial advice. It does not constitute a recommendation to buy or sell any stock, and does not take account of your objectives, or your financial situation. We aim to bring you long-term focused analysis driven by fundamental data. Note that our analysis may not factor in the latest price-sensitive company announcements or qualitative material. Simply Wall St has no position in any stocks mentioned.
Have feedback on this article? Concerned about the content? Get in touch with us directly. Alternatively, email editorial-team@simplywallst.com