
- PRICING
- LIVE QUOTES
- LEARN
- HELP


EN
Exploring Undiscovered Gems in Canada for August 2026
As the Canadian market navigates a landscape marked by rising long-term bond yields and fluctuating investor sentiment, small-cap stocks are finding themselves in an intriguing position. With economic resilience and strong corporate profit growth providing a constructive backdrop, identifying undiscovered gems becomes crucial for those looking to capitalize on opportunities that align with these dynamic conditions.
Top 10 Undiscovered Gems With Strong Fundamentals In Canada
| Name | Debt To Equity | Revenue Growth | Earnings Growth | Health Rating |
|---|---|---|---|---|
| Total Energy Services | 3.93% | 18.21% | 37.46% | ★★★★★★ |
| China Gold International Resources | 17.41% | 2.90% | 18.32% | ★★★★★★ |
| Fortuna Mining | 7.64% | 12.54% | 45.56% | ★★★★★★ |
| Calfrac Well Services | 18.28% | 8.25% | 17.87% | ★★★★★★ |
| Thor Explorations | NA | 38.45% | 61.95% | ★★★★★★ |
| Alvopetro Energy | 18.59% | 7.72% | 6.43% | ★★★★★☆ |
| Magellan Aerospace | 7.90% | 9.98% | 67.07% | ★★★★★☆ |
| Richards Group | 44.27% | -2.06% | -0.80% | ★★★★☆☆ |
| Kolibri Global Energy | 20.09% | 25.10% | -21.44% | ★★★★☆☆ |
| Logan Energy | 29.57% | 37.26% | 63.28% | ★★★☆☆☆ |
Let's review some notable picks from our screened stocks.
China Gold International Resources (TSX:CGG)
Simply Wall St Value Rating: ★★★★★★
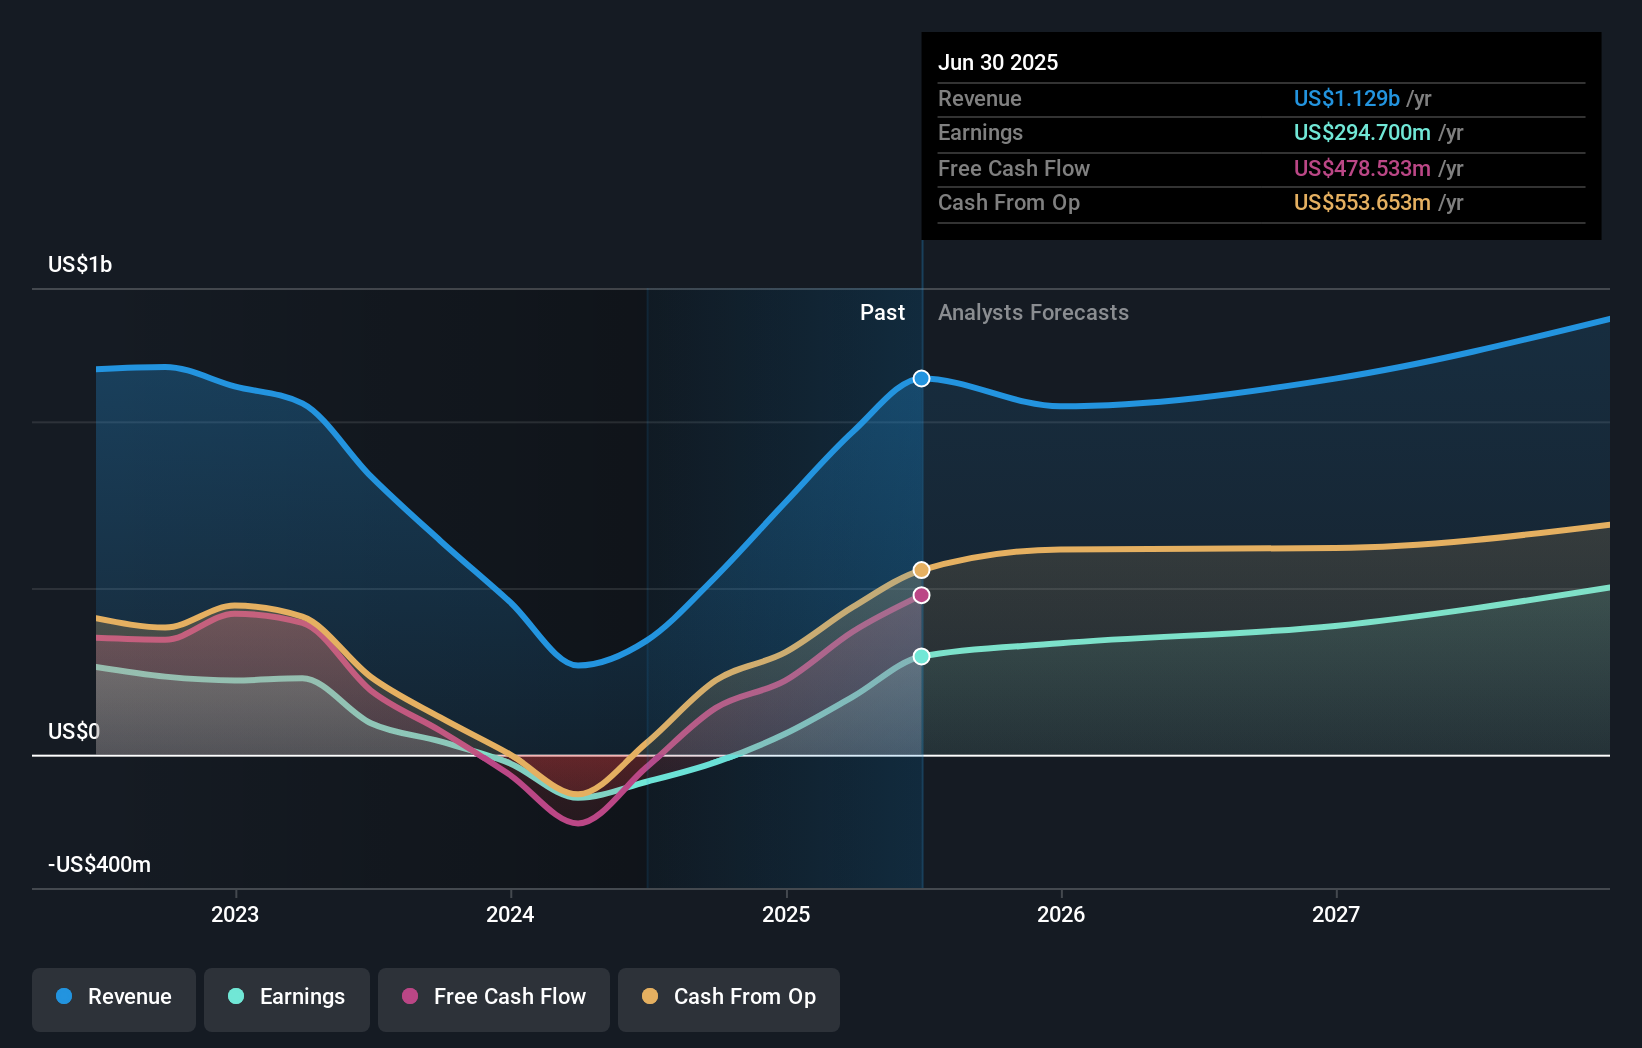
Overview: China Gold International Resources Corp. Ltd. is a mining company engaged in acquiring, exploring, developing, and mining mineral resources in China and Canada, with a market cap of CA$17.88 billion.
Operations: The company generates revenue primarily from mine-produced copper concentrate, which accounted for $1.24 billion, and mine-produced gold totaling $399.26 million.
China Gold International Resources, a notable player in the mining sector, has shown impressive financial resilience. The company's earnings grew by 162.6% last year, outpacing the industry average of 132.5%. Its debt-to-equity ratio significantly improved from 65.8% to 17.4% over five years, reflecting prudent financial management and more cash than total debt on hand. Recent challenges at the CSH Mine due to slope instability haven't dampened spirits; remediation plans are underway with capital expenditures estimated at RMB 98 million for safety measures and resumption of operations expected soon without impacting annual production guidance significantly.
Richards Group (TSX:RIC)
Simply Wall St Value Rating: ★★★★☆☆
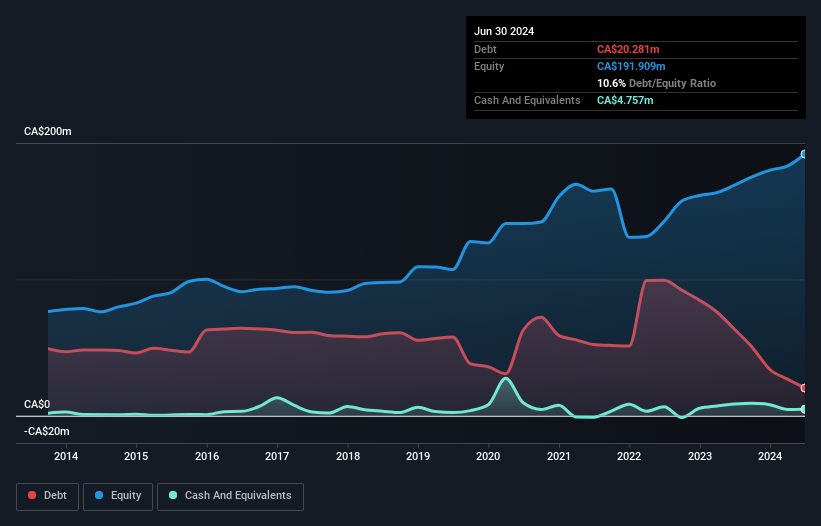
Overview: Richards Group Inc. operates in North America, focusing on the design, manufacture, and distribution of packaging containers and healthcare supplies with a market capitalization of CA$347.76 million.
Operations: Richards Group generates revenue primarily from its packaging and healthcare segments, with CA$192.02 million and CA$248.95 million respectively. The company's net profit margin stands at 12%, reflecting its ability to convert a portion of its revenue into profit after accounting for all expenses.
Richards Group, a small-cap player in the packaging industry, has shown impressive financial strides recently. Its net income skyrocketed to CAD 13.84 million for Q2 2026 from CAD 3.49 million last year, with basic earnings per share jumping to CAD 1.27 from CAD 0.32. Despite trading at a significant discount of 58% below estimated fair value, the company's high net debt-to-equity ratio of 40.1% raises some concerns about its leverage levels over time as it increased from 31.7% five years ago to now stand at a higher level of debt exposure which might impact future flexibility in operations or investments decisions going forward given current market conditions are volatile across various sectors globally including packaging where competition remains intense requiring constant innovation efforts by firms like Richards Group Inc..
- Click here and access our complete health analysis report to understand the dynamics of Richards Group.
Understand Richards Group's track record by examining our Past report.
Thor Explorations (TSXV:THX)
Simply Wall St Value Rating: ★★★★★★
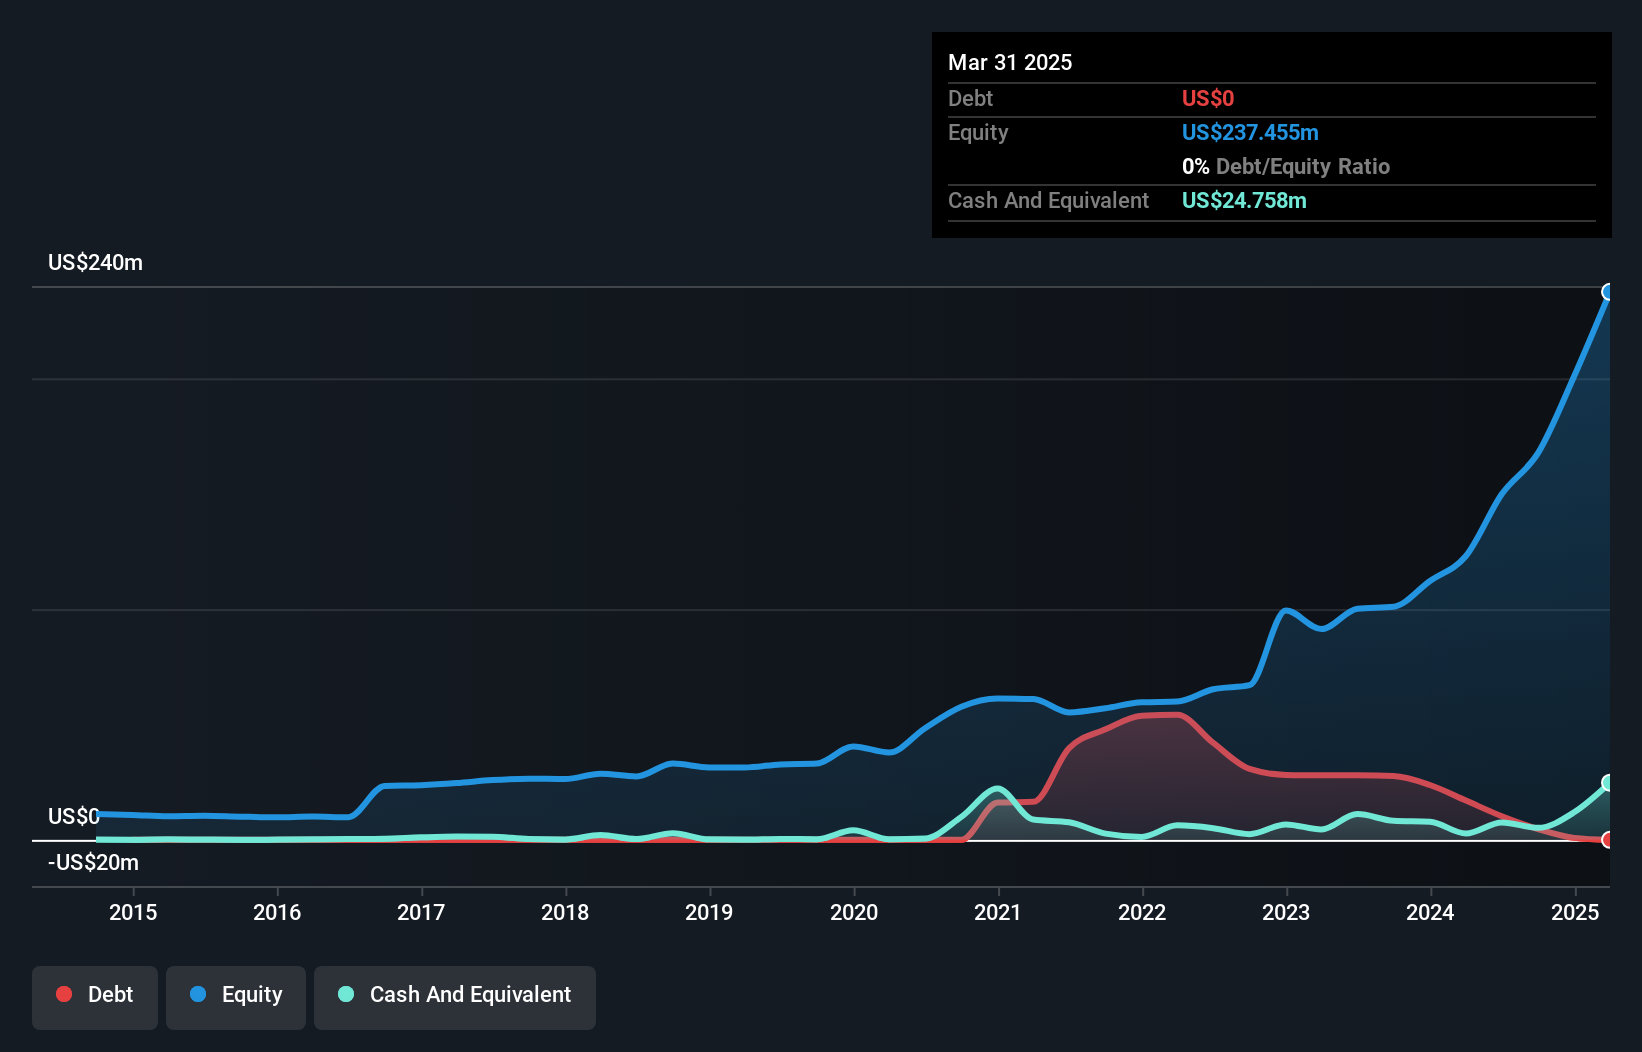
Overview: Thor Explorations Ltd., along with its subsidiaries, focuses on the production, development, and exploration of gold and has a market capitalization of CA$899.87 million.
Operations: Thor Explorations generates its revenue primarily from the Segilola Mine Project, which contributed $330.59 million. The company's financial performance is influenced by various factors including production costs and gold market prices, impacting its net profit margin.
Thor Explorations, a nimble player in the gold mining sector, operates primarily through its Segilola Gold Mine in Nigeria. The company has transformed its financial position from a net debt to net cash status over the past five years, showcasing strong fiscal discipline. Despite this progress, Thor's reliance on a single asset makes it vulnerable to fluctuations in gold prices and geopolitical risks. Recent drilling at Segilola revealed promising high-grade mineralisation that could extend the mine's life, yet analysts remain cautious about revenue growth projections amidst potential delays in diversifying operations across Senegal and Côte d'Ivoire. With earnings forecasted to decline by 4.5% annually over the next three years, investors should weigh these factors against an attractive share price of CA$1.09 compared to an estimated fair value of CA$2.41 before proceeding with investment decisions.
Taking Advantage
- Click this link to deep-dive into the 11 companies within our TSX Undiscovered Gems With Strong Fundamentals screener.
- Got skin in the game with these stocks? Elevate how you manage them by using Simply Wall St's portfolio, where intuitive tools await to help optimize your investment outcomes.
- Streamline your investment strategy with Simply Wall St's app for free and benefit from extensive research on stocks across all corners of the world.
Seeking Other Investments?
- Explore high-performing small cap companies that haven't yet garnered significant analyst attention.
- Fuel your portfolio with companies showing strong growth potential, backed by optimistic outlooks both from analysts and management.
- Find companies with promising cash flow potential yet trading below their fair value.
This article by Simply Wall St is general in nature. We provide commentary based on historical data and analyst forecasts only using an unbiased methodology and our articles are not intended to be financial advice. It does not constitute a recommendation to buy or sell any stock, and does not take account of your objectives, or your financial situation. We aim to bring you long-term focused analysis driven by fundamental data. Note that our analysis may not factor in the latest price-sensitive company announcements or qualitative material. Simply Wall St has no position in any stocks mentioned.
Have feedback on this article? Concerned about the content? Get in touch with us directly. Alternatively, email editorial-team@simplywallst.com