
- PRICING
- LIVE QUOTES
- LEARN
- HELP


EN
3 European Dividend Stocks Yielding Up To 5.3%
The European market has recently experienced a slight downturn, with the pan-European STOXX Europe 600 Index ending the week down amid global bond sell-offs and inflation concerns. Despite this cautious atmosphere, dividend stocks remain an attractive option for investors seeking steady income in uncertain times. In such a climate, selecting dividend stocks that offer robust yields and stable financials can be crucial for maintaining a balanced portfolio.
Top 10 Dividend Stocks In Europe
| Name | Dividend Yield | Dividend Rating |
| UNIQA Insurance Group (WBAG:UQA) | 4.10% | ★★★★★☆ |
| Telekom Austria (WBAG:TKA) | 4.16% | ★★★★★★ |
| Swiss Re (SWX:SREN) | 4.56% | ★★★★★☆ |
| Rubis (ENXTPA:RUI) | 6.16% | ★★★★★★ |
| Maire (BIT:MAIRE) | 4.86% | ★★★★★☆ |
| Hannover Rück (XTRA:HNR1) | 4.93% | ★★★★★★ |
| EFG International (SWX:EFGN) | 4.01% | ★★★★★☆ |
| Edel SE KGaA (XTRA:EDL) | 6.47% | ★★★★★★ |
| d'Amico International Shipping (BIT:DIS) | 4.69% | ★★★★★☆ |
| Cembra Money Bank (SWX:CMBN) | 5.24% | ★★★★★★ |
Click here to see the full list of 191 stocks from our Top European Dividend Stocks screener.
Let's uncover some gems from our specialized screener.
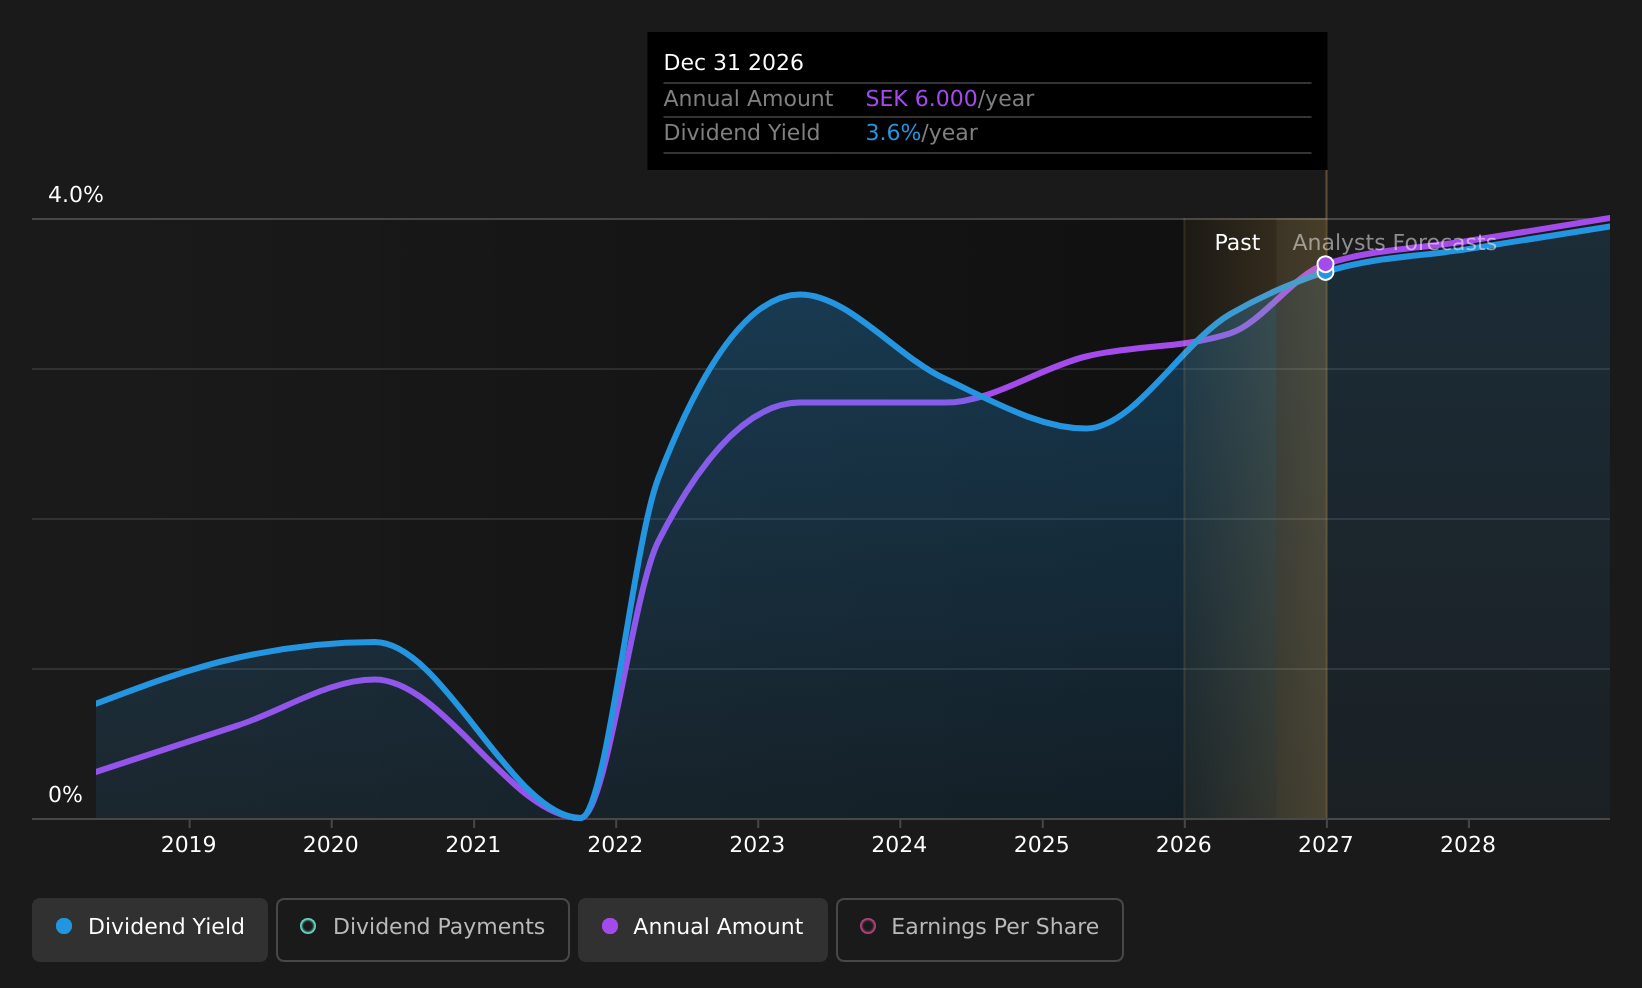
Rejlers (OM:REJL B)
Simply Wall St Dividend Rating: ★★★★☆☆
Overview: Rejlers AB (publ) is an engineering consultancy firm operating in Sweden, Finland, Norway, and Abu Dhabi with a market capitalization of approximately SEK3.72 billion.
Operations: Rejlers AB (publ) generates revenue through its engineering consultancy services with SEK3.09 billion from Sweden, SEK1.46 billion from Finland, and SEK404.70 million from Norway (including Embriq).
Dividend Yield: 3.2%
Rejlers' dividend payments have been volatile over the past decade, despite showing some growth. The current yield of 3.22% is below the top tier in Sweden, yet dividends are well-covered by earnings and cash flows with a payout ratio of 69.9% and a cash payout ratio of 48.2%. Recent earnings showed increased sales but decreased net income year-on-year, potentially impacting future dividend stability amidst ongoing projects like Finland's Digirail initiative.
- Navigate through the intricacies of Rejlers with our comprehensive dividend report here.
- According our valuation report, there's an indication that Rejlers' share price might be on the cheaper side.
Banque Cantonale Vaudoise (SWX:BCVN)
Simply Wall St Dividend Rating: ★★★★☆☆
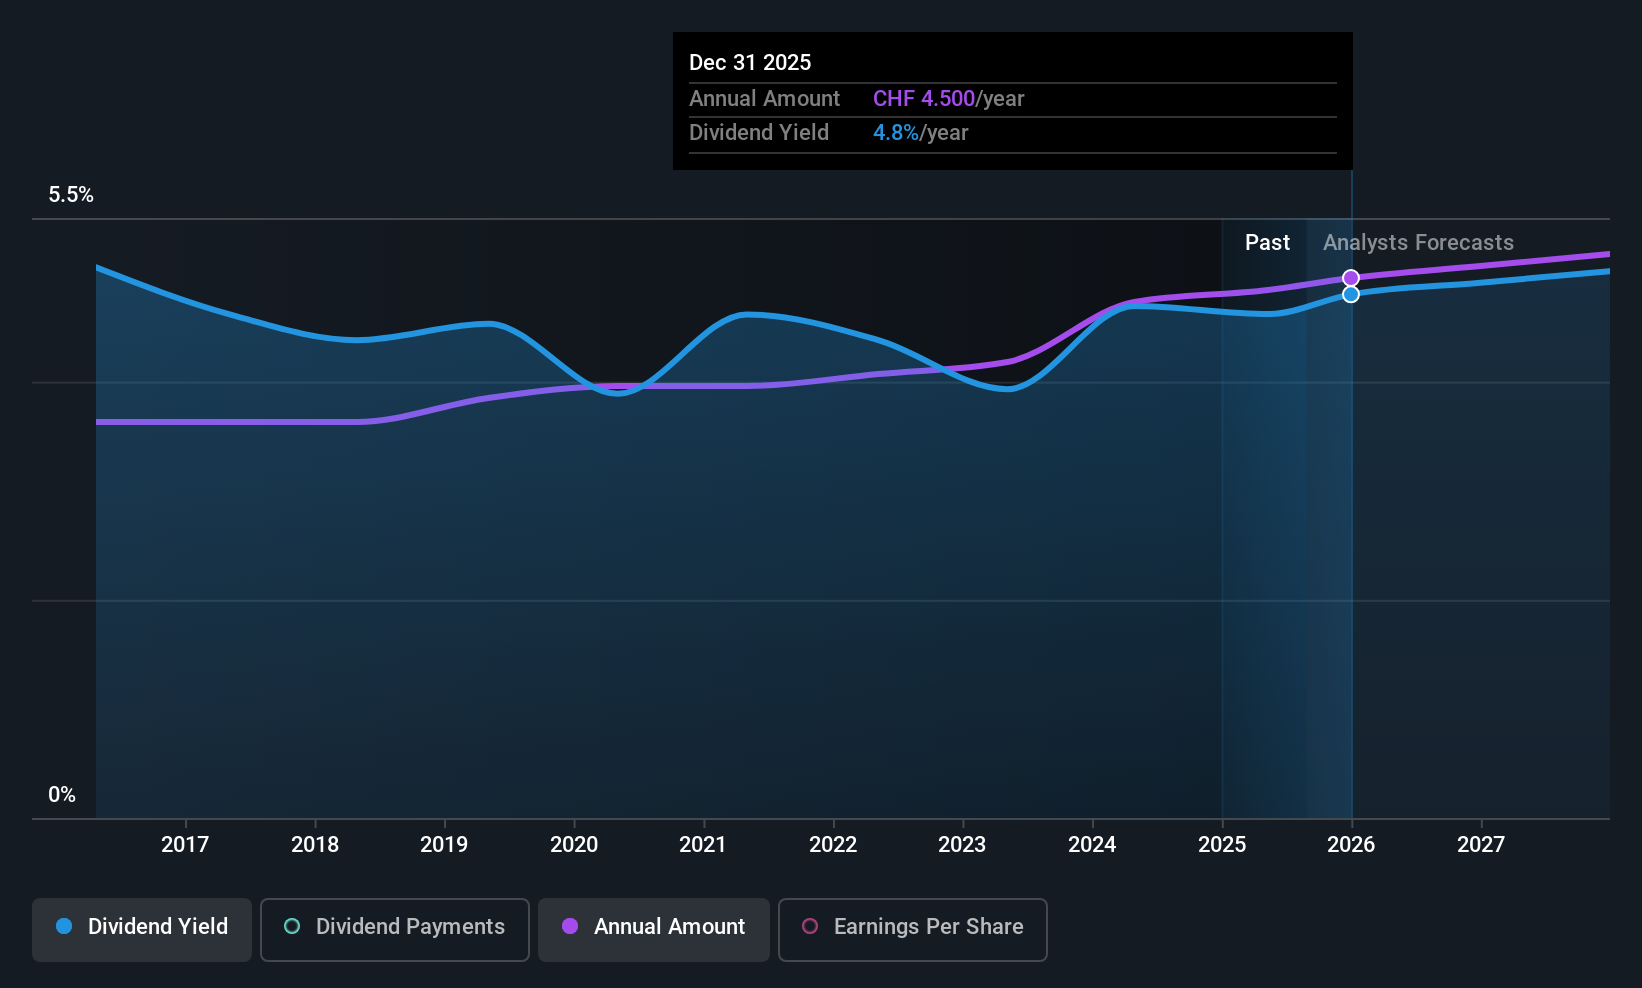
Overview: Banque Cantonale Vaudoise provides a range of financial services across Vaud Canton, Switzerland, the European Union, North America, and internationally with a market cap of CHF10.83 billion.
Operations: Banque Cantonale Vaudoise generates revenue through several segments, including Trading (CHF66.40 million), Retail Banking (CHF298.80 million), Corporate Center (CHF30.30 million), Corporate Banking (CHF279.20 million), and Wealth Management (CHF488.50 million).
Dividend Yield: 3.5%
Banque Cantonale Vaudoise's dividends have been stable and growing over the past decade, though its 3.49% yield is below the top tier in Switzerland. The current payout ratio of 87.9% suggests earnings cover dividends, but there's insufficient data on future coverage by earnings or cash flows. Recent half-year results showed net income growth to CHF 225 million from CHF 214.5 million, despite a slight dip in net interest income, indicating potential resilience in dividend payments.
- Dive into the specifics of Banque Cantonale Vaudoise here with our thorough dividend report.
- Insights from our recent valuation report point to the potential overvaluation of Banque Cantonale Vaudoise shares in the market.
Mensch und Maschine Software (XTRA:MUM)
Simply Wall St Dividend Rating: ★★★★☆☆
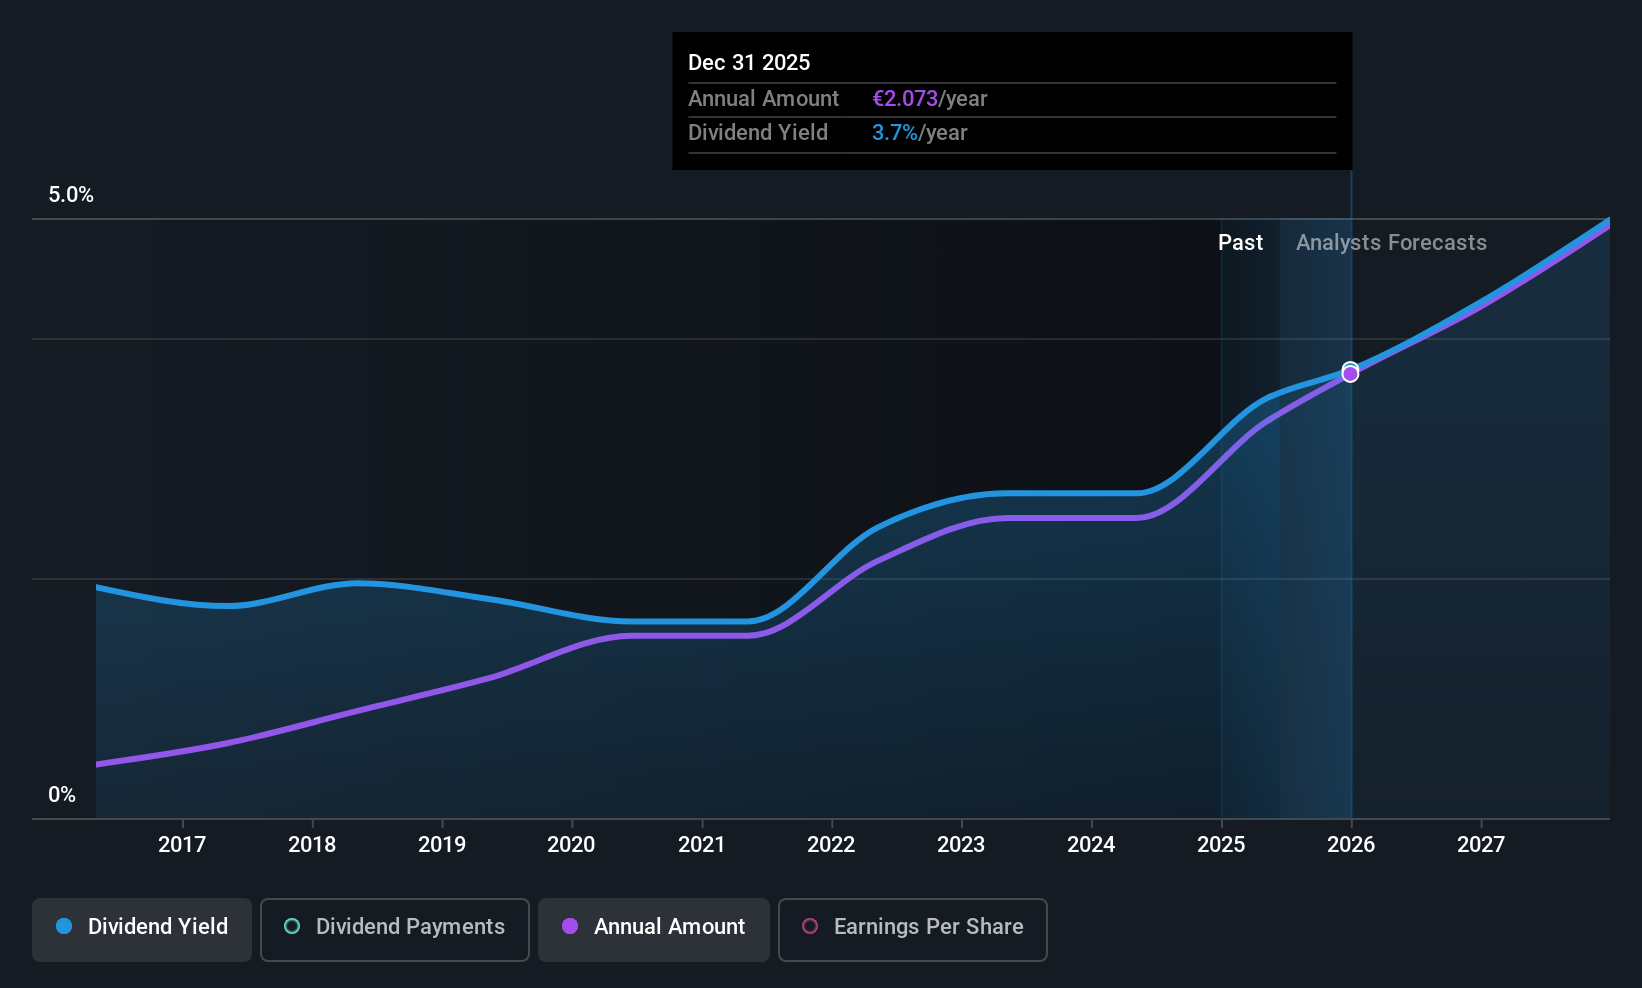
Overview: Mensch und Maschine Software SE offers technical software and digitization solutions in areas such as computer-aided design, manufacturing and engineering, product data and lifecycle management, and building information modeling with a market cap of €612.53 million.
Operations: Mensch und Maschine Software SE's revenue is primarily derived from its M+M Software segment, which contributes €119.92 million, and its M+M Digitalization segment, which adds €128.55 million.
Dividend Yield: 5.4%
Mensch und Maschine Software's dividend yield of 5.38% ranks in the top 25% in Germany, yet its sustainability is questionable due to high payout ratios—102.1% of earnings and 183.1% of free cash flow. Despite stable dividends over the past decade, recent financials show a slight decline in quarterly net income to €6.25 million from €7.19 million, with six-month sales growth indicating some underlying business strength despite these challenges.
- Unlock comprehensive insights into our analysis of Mensch und Maschine Software stock in this dividend report.
- Our expertly prepared valuation report Mensch und Maschine Software implies its share price may be lower than expected.
Turning Ideas Into Actions
- Explore the 191 names from our Top European Dividend Stocks screener here.
- Already own these companies? Bring clarity to your investment decisions by linking up your portfolio with Simply Wall St, where you can monitor all the vital signs of your stocks effortlessly.
- Streamline your investment strategy with Simply Wall St's app for free and benefit from extensive research on stocks across all corners of the world.
Interested In Other Possibilities?
- Explore high-performing small cap companies that haven't yet garnered significant analyst attention.
- Fuel your portfolio with companies showing strong growth potential, backed by optimistic outlooks both from analysts and management.
- Find companies with promising cash flow potential yet trading below their fair value.
This article by Simply Wall St is general in nature. We provide commentary based on historical data and analyst forecasts only using an unbiased methodology and our articles are not intended to be financial advice. It does not constitute a recommendation to buy or sell any stock, and does not take account of your objectives, or your financial situation. We aim to bring you long-term focused analysis driven by fundamental data. Note that our analysis may not factor in the latest price-sensitive company announcements or qualitative material. Simply Wall St has no position in any stocks mentioned.
Have feedback on this article? Concerned about the content? Get in touch with us directly. Alternatively, email editorial-team@simplywallst.com