
- PRICING
- LIVE QUOTES
- LEARN
- HELP


EN
Global Stocks Possibly Undervalued By Market Estimates In August 2026
As global markets face heightened volatility, driven by elevated Treasury yields and geopolitical tensions, investors are increasingly cautious. Despite these challenges, opportunities may exist in stocks that the market has potentially undervalued due to broader economic uncertainties. Identifying such stocks requires a keen understanding of their intrinsic value relative to current market conditions.
Top 10 Undervalued Stocks Based On Cash Flows
| Name | Current Price | Fair Value (Est) | Discount (Est) |
| VIGO Photonics (WSE:VGO) | PLN486.00 | PLN962.05 | 49.5% |
| SILICON2 (KOSDAQ:A257720) | ₩51800.00 | ₩103326.49 | 49.9% |
| Shiyue Daotian Group (SEHK:9676) | HK$4.64 | HK$9.20 | 49.6% |
| Sahara International Petrochemical (SASE:2310) | SAR13.35 | SAR26.55 | 49.7% |
| HUMAN MADE (TSE:456A) | ¥1684.00 | ¥3336.60 | 49.5% |
| Gabriel Holding (CPSE:GABR) | DKK262.00 | DKK523.36 | 49.9% |
| F-Secure Oyj (HLSE:FSECURE) | €2.00 | €3.96 | 49.5% |
| Dellia Group (OB:DELIA) | NOK19.26 | NOK38.33 | 49.7% |
| CMTXLtd (KOSDAQ:A388210) | ₩73200.00 | ₩144974.38 | 49.5% |
| Borregaard (OB:BRG) | NOK156.60 | NOK309.55 | 49.4% |
Let's dive into some prime choices out of the screener.
Shennan Circuits (SZSE:002916)
Overview: Shennan Circuits Co., Ltd. designs, manufactures, and sells printed circuit boards, packaging substrates, and electronic assemblies both in China and internationally, with a market cap of CN¥232.28 billion.
Operations: The company's revenue is primarily derived from the design, manufacture, and sale of printed circuit boards, packaging substrates, and electronic assemblies across domestic and international markets.
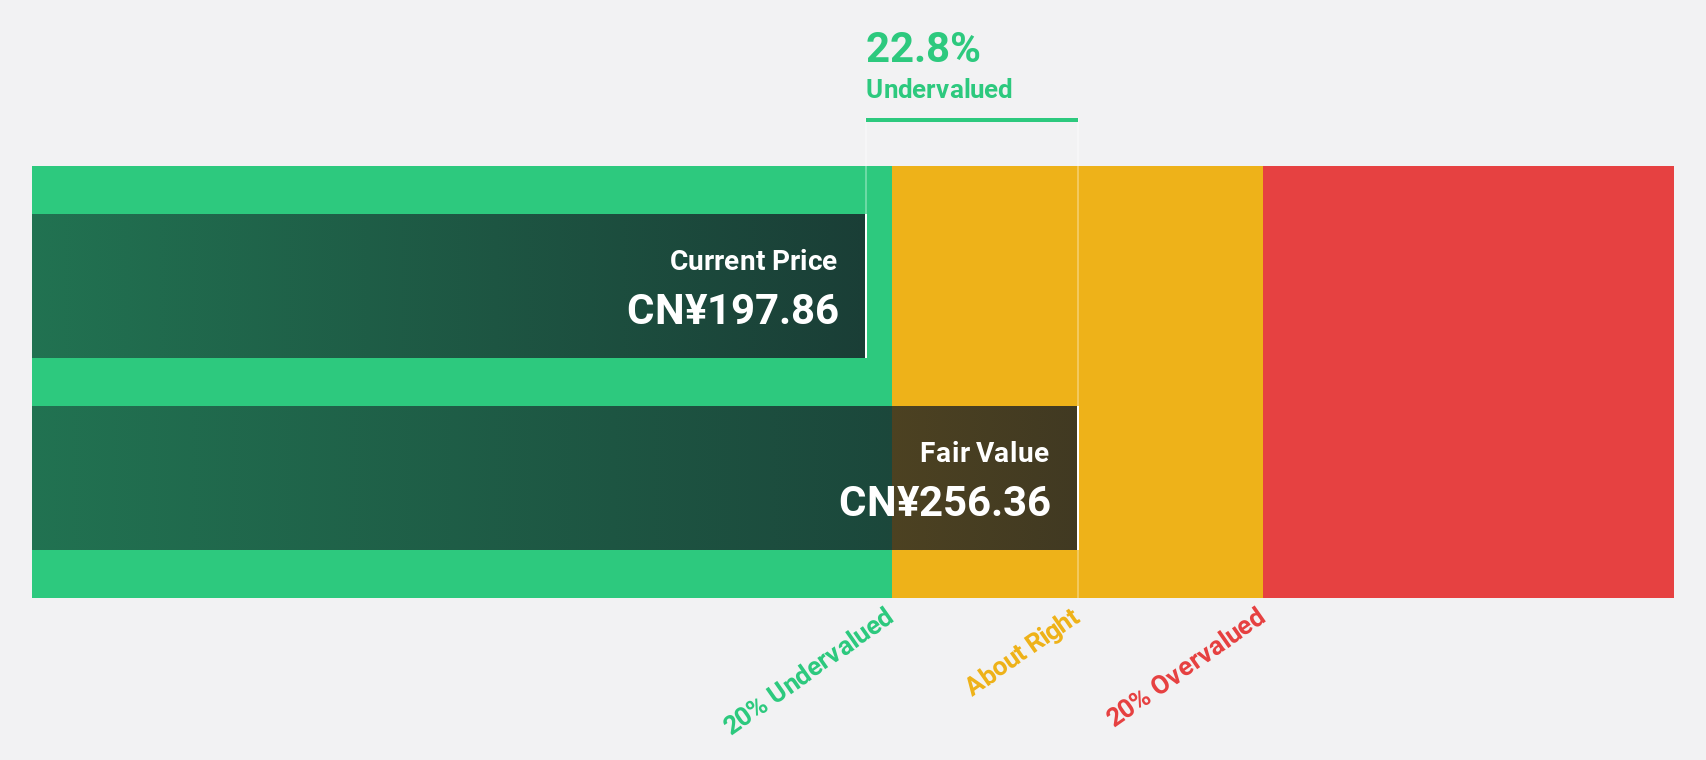
Estimated Discount To Fair Value: 14.0%
Shennan Circuits is trading 14% below its estimated fair value, with earnings projected to grow significantly at 35.7% annually, outpacing the Chinese market's growth. Despite this, its dividend yield of 0.69% isn't well-covered by free cash flows. Recent approval for a private placement aims to raise up to CN¥4.88 billion, reflecting strategic capital enhancement efforts amid volatile share price movements over the past three months.
- According our earnings growth report, there's an indication that Shennan Circuits might be ready to expand.
- Unlock comprehensive insights into our analysis of Shennan Circuits stock in this financial health report.
JX Advanced Metals (TSE:5016)
Overview: JX Advanced Metals Corporation develops, manufactures, and sells copper and rare metal materials in Japan, with a market capitalization of ¥3.63 trillion.
Operations: Revenue Segments (in millions of ¥): Copper Products: ¥1,200,000; Rare Metals: ¥850,000. The company generates revenue through its copper products segment amounting to ¥1.20 trillion and its rare metals segment contributing ¥850 billion.
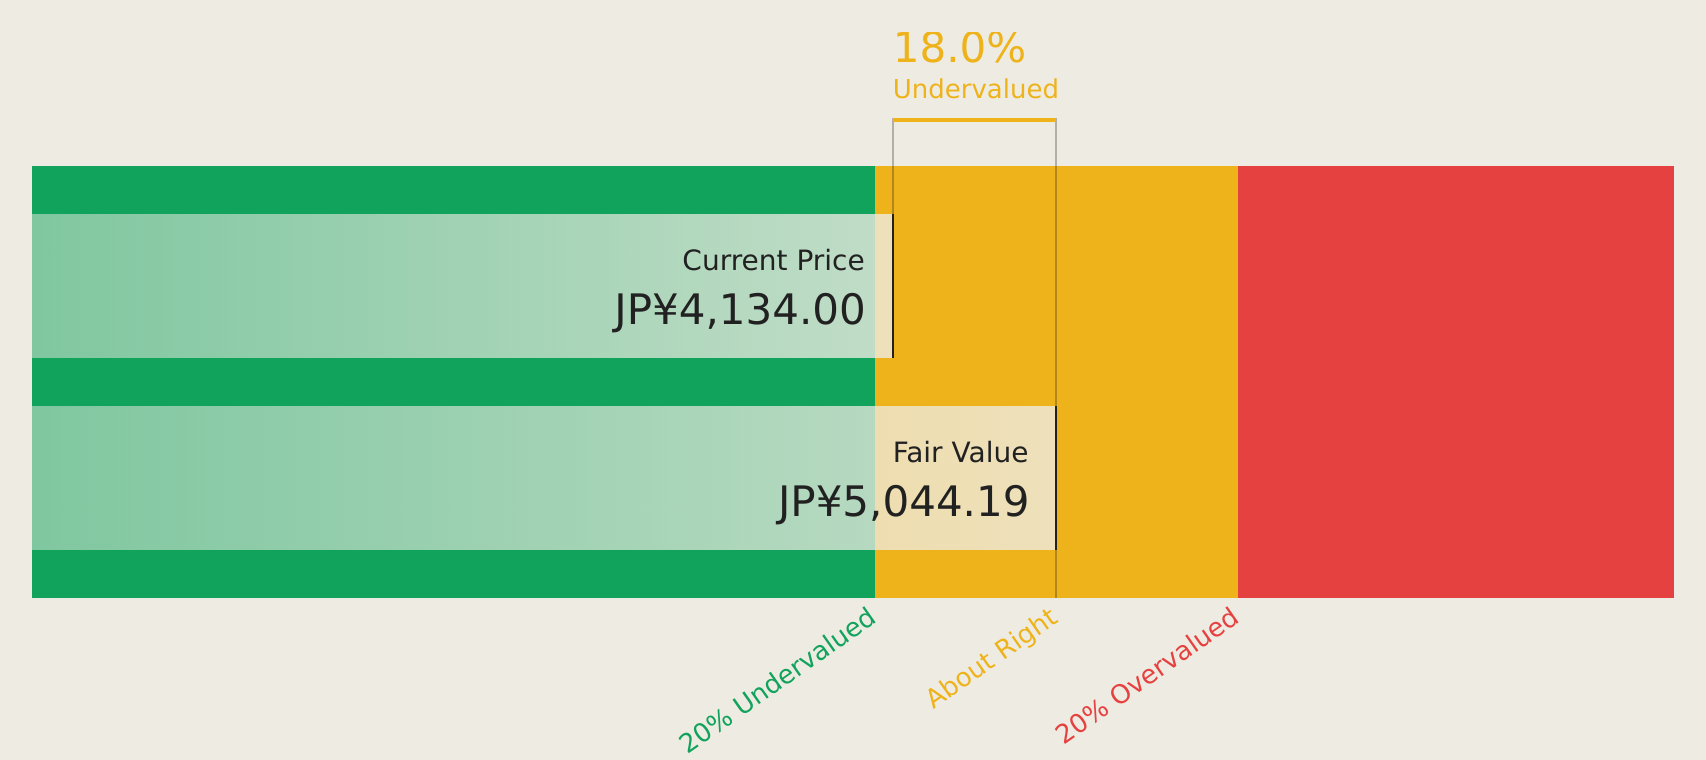
Estimated Discount To Fair Value: 14.0%
JX Advanced Metals is trading 14% below its estimated fair value, with earnings projected to grow at 12.81% annually, surpassing the Japanese market's growth rate. Despite high volatility in share price recently, the company revised its fiscal year revenue forecast upwards to ¥1.03 trillion due to increased sales volumes and improved pricing in key areas like AI data centers. However, dividends are expected to decrease from ¥25.00 to ¥10.00 per share year-end.
- Our expertly prepared growth report on JX Advanced Metals implies its future financial outlook may be stronger than recent results.
- Get an in-depth perspective on JX Advanced Metals' balance sheet by reading our health report here.
MediaTek (TWSE:2454)
Overview: MediaTek Inc. is a company that focuses on the research, development, production, manufacture, and marketing of multimedia integrated circuits (ICs) in Taiwan and globally, with a market cap of NT$5.96 trillion.
Operations: The company's revenue primarily comes from its Multimedia and Mobile Phone Chips and Other Integrated Circuit Design Products segment, generating NT$593.62 billion.
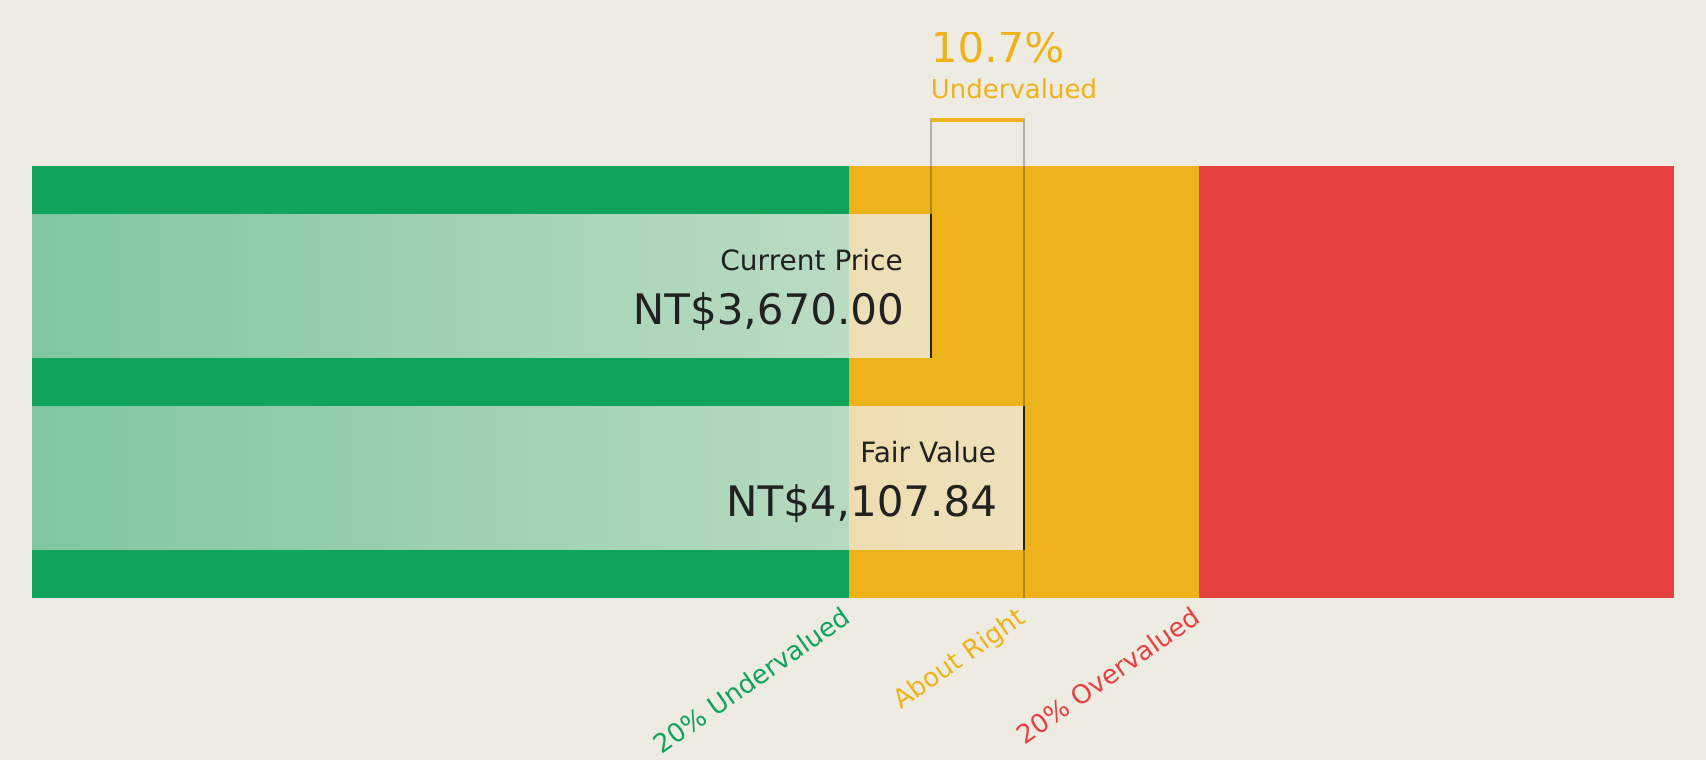
Estimated Discount To Fair Value: 22.9%
MediaTek is trading 22.9% below its estimated fair value, with earnings forecasted to grow significantly at 41.7% annually, outpacing the Taiwan market. Despite recent share price volatility and a decline in net income for Q2 2026, MediaTek expects high single-digit revenue growth for the year. Collaborations with NVIDIA and Ericsson highlight its strategic advancements in AI and connectivity solutions, potentially bolstering future cash flows despite current challenges.
- Insights from our recent growth report point to a promising forecast for MediaTek's business outlook.
- Click here and access our complete balance sheet health report to understand the dynamics of MediaTek.
Key Takeaways
- Explore the 458 names from our Undervalued Global Stocks Based On Cash Flows screener here.
- Already own these companies? Link your portfolio to Simply Wall St and get alerts on any new warning signs to your stocks.
- Enhance your investing ability with the Simply Wall St app and enjoy free access to essential market intelligence spanning every continent.
Curious About Other Options?
- Explore high-performing small cap companies that haven't yet garnered significant analyst attention.
- Diversify your portfolio with solid dividend payers offering reliable income streams to weather potential market turbulence.
- Fuel your portfolio with companies showing strong growth potential, backed by optimistic outlooks both from analysts and management.
This article by Simply Wall St is general in nature. We provide commentary based on historical data and analyst forecasts only using an unbiased methodology and our articles are not intended to be financial advice. It does not constitute a recommendation to buy or sell any stock, and does not take account of your objectives, or your financial situation. We aim to bring you long-term focused analysis driven by fundamental data. Note that our analysis may not factor in the latest price-sensitive company announcements or qualitative material. Simply Wall St has no position in any stocks mentioned.
Have feedback on this article? Concerned about the content? Get in touch with us directly. Alternatively, email editorial-team@simplywallst.com