
- PRICING
- LIVE QUOTES
- LEARN
- HELP


EN
Brookfield Wealth Solutions (BNT) At 120x P E Looks Pricey On Mixed Earnings
Why Brookfield Wealth Solutions stock is in focus now
Brookfield Wealth Solutions (BNT) is back on investor radar after its August 13 earnings release showed higher second quarter and first half revenue, alongside a sharp hit to profitability and a swing to a six month net loss.
The company also affirmed a quarterly return of capital of $0.07 per class A and class B share, payable on September 29 to shareholders of record on September 14. This keeps capital returns in play despite the weaker headline earnings.
See our latest analysis for Brookfield Wealth Solutions.
At a share price of US$42.04, Brookfield Wealth Solutions has seen short term share price pressure, with the 90 day share price return down 8.6% and the year to date share price return down 9.9%, while the 3 year total shareholder return of 92.7% remains strong. The recent earnings release and continued return of capital are likely shaping how investors weigh shorter term earnings volatility against that longer term track record.
If you are reassessing your portfolio after Brookfield Wealth Solutions' results, this can be a useful moment to scan other opportunities and uncover 20 top founder-led companies
Bulls point to Brookfield Wealth Solutions' higher revenue and ongoing capital returns. Bears focus on the recent net loss and weaker profitability. Which case lines up better with the valuation investors face today?
Preferred P/E of 120.3x for Brookfield Wealth Solutions: Is it justified?
Brookfield Wealth Solutions currently trades on a P/E of 120.3x, based on its recent earnings, while the last close sits at $42.04. That is a steep premium to both its own recent profitability and to peers, so it raises questions about what kind of earnings profile investors are effectively pricing in.
The P/E ratio compares the share price to earnings per share and is a quick way to see how much investors are paying for each dollar of profit. For an insurance and retirement services company like Brookfield Wealth Solutions, this often reflects expectations around the stability and growth of earnings, the perceived quality of its underwriting and investment results, and how investors view its capital allocation and balance sheet.
Here, the signals are mixed. On one hand, Brookfield Wealth Solutions has grown earnings by an average of 30.6% per year over the past 5 years and is assessed to have high quality earnings. On the other hand, earnings fell sharply over the last year, profit margins slipped from 5.5% to 1.1%, Return on Equity is a modest 1%, and shareholders have been diluted over the past year. With insufficient data on future earnings or revenue forecasts, that premium P/E rests largely on the company’s track record rather than visible projections.
Compared with valuation anchors across the sector, the premium is even clearer. Brookfield Wealth Solutions trades on a P/E of 120.3x. The peer group average sits at 13.1x and the wider US Insurance industry average is 11x. That leaves the stock on a multiple that is many times higher than comparable insurers, without a fair ratio estimate available to suggest where the market could eventually settle.
See what the numbers say about this price — find out in our valuation breakdown.
Result: Price-to-Earnings of 120.3x (OVERVALUED)
However, the recent net loss and very high 120.3x P/E leave Brookfield Wealth Solutions exposed if profitability stays weak or if investor patience shortens.
Find out about the key risks to this Brookfield Wealth Solutions narrative.
Another view on Brookfield Wealth Solutions' valuation
The SWS DCF model points in the same direction as the P/E check but with a different angle. Brookfield Wealth Solutions trades at $42.04 while the model estimates future cash flow value at $32.77. That suggests the market price is higher than this cash flow view. How comfortable are you paying above that estimate?
Look into how the SWS DCF model arrives at its fair value.
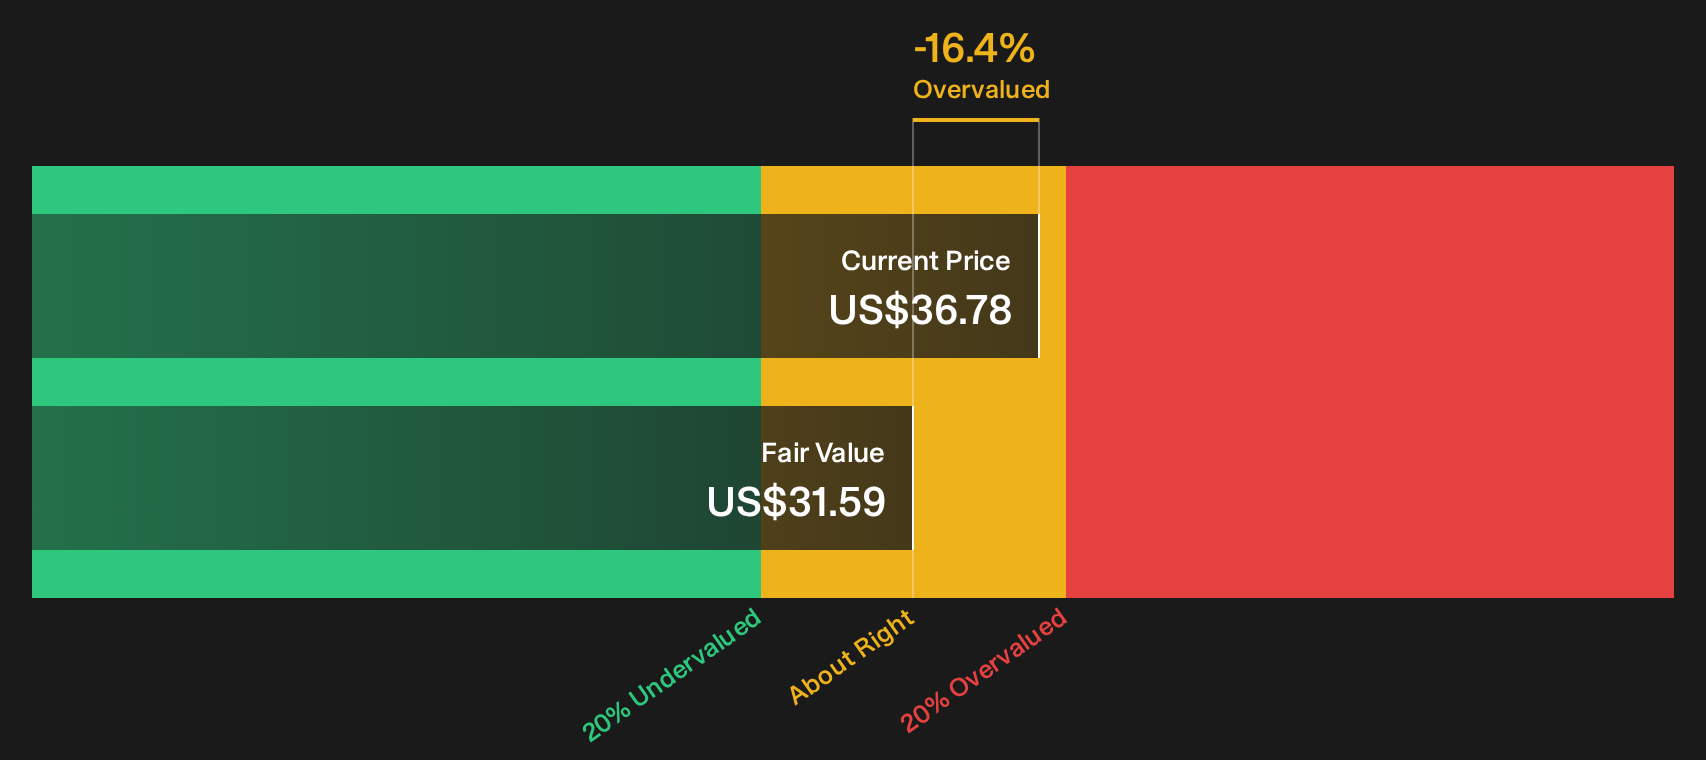
Simply Wall St performs a discounted cash flow (DCF) on every stock in the world every day (check out Brookfield Wealth Solutions for example). We show the entire calculation in full. You can track the result in your watchlist or portfolio and be alerted when this changes, or use our stock screener to discover 49 high quality undervalued stocks. If you save a screener we even alert you when new companies match - so you never miss a potential opportunity.
Next Steps
If the mixed tone of this Brookfield Wealth Solutions update leaves you unsure, act while the details are fresh and compare the story carefully with the 2 important warning signs.
Looking for more investment ideas beyond Brookfield Wealth Solutions?
Brookfield Wealth Solutions may not fully match your checklist right now. This is a good moment to widen your search and see what else the market offers.
- Spot fresh potential by reviewing screener containing 18 high quality undiscovered gems that combine quality fundamentals with lower market attention.
- Strengthen your defensive side by scanning 74 resilient stocks with low risk scores that aim for resilience when conditions feel uncertain.
- Focus on financial strength by checking solid balance sheet and fundamentals stocks screener (51 results) that pair robust balance sheets with sound underlying businesses.
This article by Simply Wall St is general in nature. We provide commentary based on historical data and analyst forecasts only using an unbiased methodology and our articles are not intended to be financial advice. It does not constitute a recommendation to buy or sell any stock, and does not take account of your objectives, or your financial situation. We aim to bring you long-term focused analysis driven by fundamental data. Note that our analysis may not factor in the latest price-sensitive company announcements or qualitative material. Simply Wall St has no position in any stocks mentioned.
Have feedback on this article? Concerned about the content? Get in touch with us directly. Alternatively, email editorial-team@simplywallst.com