
- PRICING
- LIVE QUOTES
- LEARN
- HELP


EN
Loews (L) Cools After A Mixed Stretch, Is The Stock Above Fair Value?
Loews (L) recently caught investor attention after its shares closed at $111.45, with near term returns mixed and longer term performance stronger. The move is prompting a closer look at how the diversified insurer is positioned.
See our latest analysis for Loews.
Over the past month the stock has cooled, with a 1 month share price return of 5.47% lower. However, the year to date share price return of 6.49% and 1 year total shareholder return of 16.78% point to momentum that has been stronger over a longer stretch.
If Loews has you rethinking your portfolio mix, it can be useful to compare it with other financials or adjacent sectors through the Simply Wall St screener for 20 top founder-led companies
Given Loews' recent cooling after a strong longer term run, the key issue now is whether the current price still leaves enough upside to justify the risks. How does the valuation stack up at about $111 a share?
Price-to-Earnings of 13.5x: Is it justified?
Loews is trading on a P/E of 13.5x at a last close of $111.45, which places the stock above both its industry and peer averages on this metric.
The P/E ratio compares the current share price to earnings per share and is a common way investors assess what they are paying for each dollar of profit. For an insurer like Loews, this matters because earnings quality, consistency, and growth often drive how much of a premium or discount the market is willing to assign.
In Loews' case, the P/E of 13.5x is higher than the US Insurance industry average of 11x and above the peer group average of 11.3x. This indicates investors are paying more for Loews' earnings than for many comparable insurers, even though the company is described as expensive on this basis. At the same time, the P/E is below the broader US market level of 19.1x, which presents Loews as cheaper than the wider market but on the richer side within its own sector.
See what the numbers say about this price — find out in our valuation breakdown.
Result: Price-to-Earnings of 13.5x (OVERVALUED)
However, investors still need to weigh risks such as the diversified exposure to insurance, pipelines, hotels and plastics, as well as the current premium P/E relative to sector peers.
Find out about the key risks to this Loews narrative.
Another view on Loews using cash flows
While the P/E ratio presents Loews as expensive compared with insurance peers, the SWS DCF model suggests a slightly different angle. On this view, the current share price of $111.45 is a bit above an estimated future cash flow value of $109.41, which points to a mild level of overvaluation rather than a deep mismatch. The gap is not huge, so the key question for you is whether that small premium feels acceptable for this mix of businesses and profit history.
Look into how the SWS DCF model arrives at its fair value.
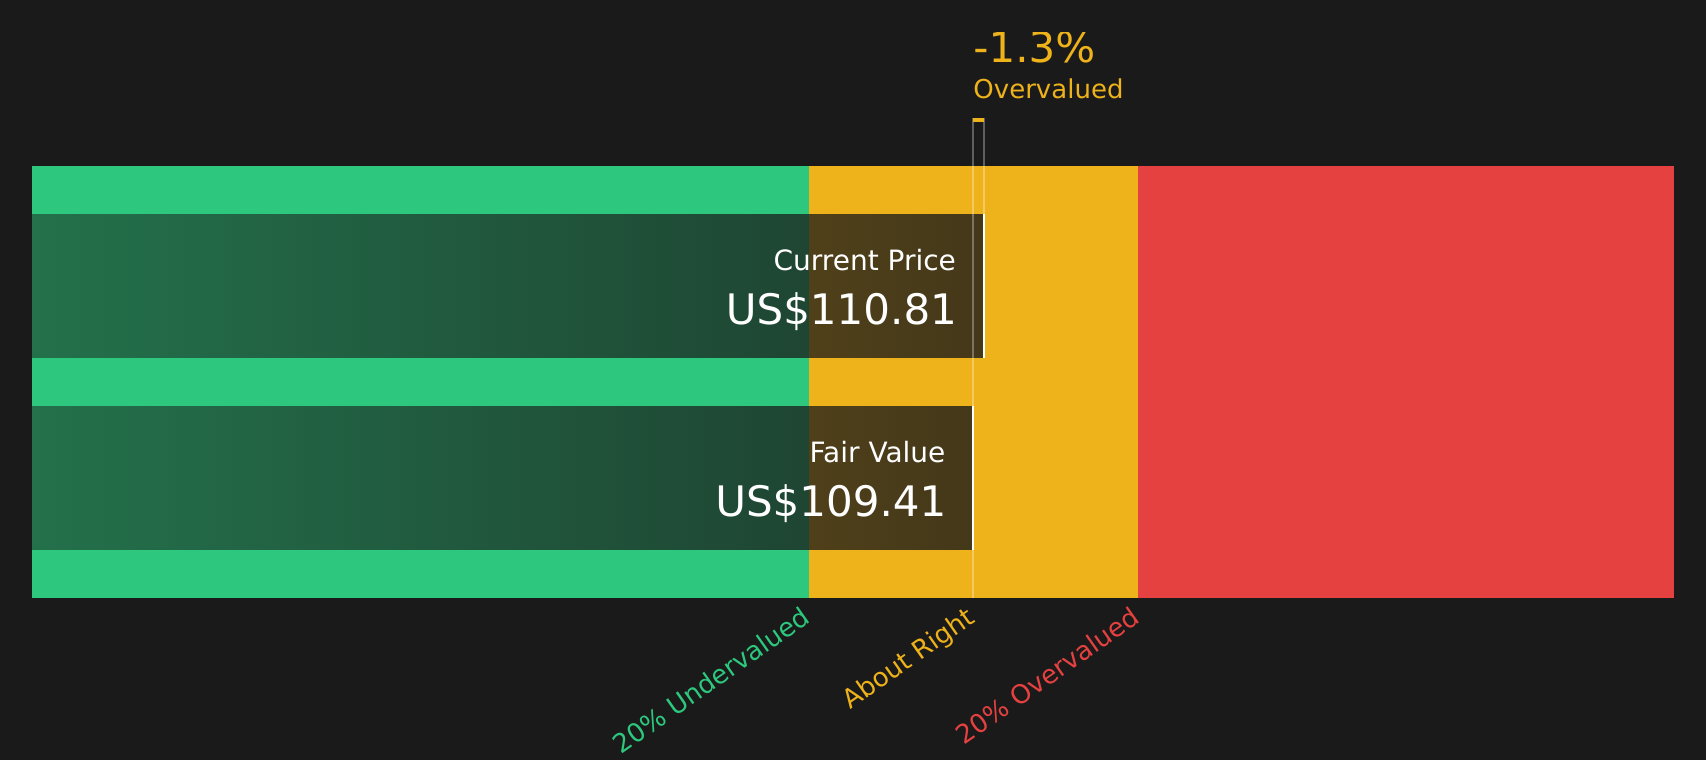
Simply Wall St performs a discounted cash flow (DCF) on every stock in the world every day (check out Loews for example). We show the entire calculation in full. You can track the result in your watchlist or portfolio and be alerted when this changes, or use our stock screener to discover 49 high quality undervalued stocks. If you save a screener we even alert you when new companies match - so you never miss a potential opportunity.
Next Steps
With sentiment on Loews mixed between valuation questions and identified positives, it can help to review the numbers yourself and decide where you stand. To see which potential bright spots others are focused on, take a closer look at the 2 key rewards
Looking for more investment ideas beyond Loews?
If Loews has sharpened your interest in fresh opportunities, do not stop here. A few minutes with focused stock lists can surface ideas you might otherwise miss.
- Explore income-focused ideas by reviewing companies that feature attractive yields and solid fundamentals through the 12 dividend fortresses.
- Identify potential value opportunities by scanning the screener containing 18 high quality undiscovered gems before they appear on more crowded watchlists.
- Emphasize capital preservation by checking companies that score well on stability in the 74 resilient stocks with low risk scores.
This article by Simply Wall St is general in nature. We provide commentary based on historical data and analyst forecasts only using an unbiased methodology and our articles are not intended to be financial advice. It does not constitute a recommendation to buy or sell any stock, and does not take account of your objectives, or your financial situation. We aim to bring you long-term focused analysis driven by fundamental data. Note that our analysis may not factor in the latest price-sensitive company announcements or qualitative material. Simply Wall St has no position in any stocks mentioned.
Have feedback on this article? Concerned about the content? Get in touch with us directly. Alternatively, email editorial-team@simplywallst.com