
- PRICING
- LIVE QUOTES
- LEARN
- HELP


EN
Goodman Group (ASX:GMG) Following Strong Full Year Results Is The Upside Already Priced In
Goodman Group (ASX:GMG) has released new figures with full year results to 30 June 2026, reporting higher sales, revenue and net income that provide investors with updated data to assess the stock.
See our latest analysis for Goodman Group.
Goodman Group’s latest A$27.55 share price comes after a mixed stretch, with the 1 day share price return up 1.03% but the year to date share price return down 10.61%. However, the 3 year total shareholder return of 24.68% shows longer term holders have still seen gains.
If you want to see what other infrastructure linked stocks are doing after earnings season, it could be a good time to scan the market using our 38 power grid technology and infrastructure stocks
Bulls will point to Goodman Group’s higher earnings and global footprint, while bears will focus on recent share price weakness and questions about what is already priced in. Which side does the current valuation support next?
Most Popular Narrative: 20.5% Undervalued
Goodman Group's most followed narrative places fair value at A$34.64 per share, comfortably above the latest A$27.55 close. This naturally raises questions about what is driving that gap.
Acceleration in data center development, supported by secured power in high-barrier-to-entry metro locations and capital partnerships, positions Goodman to benefit from AI, cloud, and digital infrastructure demand, with a significant increase in Work-In-Progress expected to drive revenue and long-term earnings growth.
Investors may want to see what kind of revenue curve and margin profile this narrative is assuming. The story leans heavily on scaled data centre earnings and a richer profit mix. It may be useful to understand which specific assumptions on growth, profitability, and valuation multiples are most influential in reaching that A$34.64 fair value.
Result: Fair Value of A$34.64 (UNDERVALUED)
Have a read of the narrative in full and understand what's behind the forecasts.
However, Goodman Group’s heavy data centre investment and reliance on external capital could still bite if costs rise, or if partner appetite and tenant demand soften.
Find out about the key risks to this Goodman Group narrative.
Another View: What P/E Says About Goodman Group
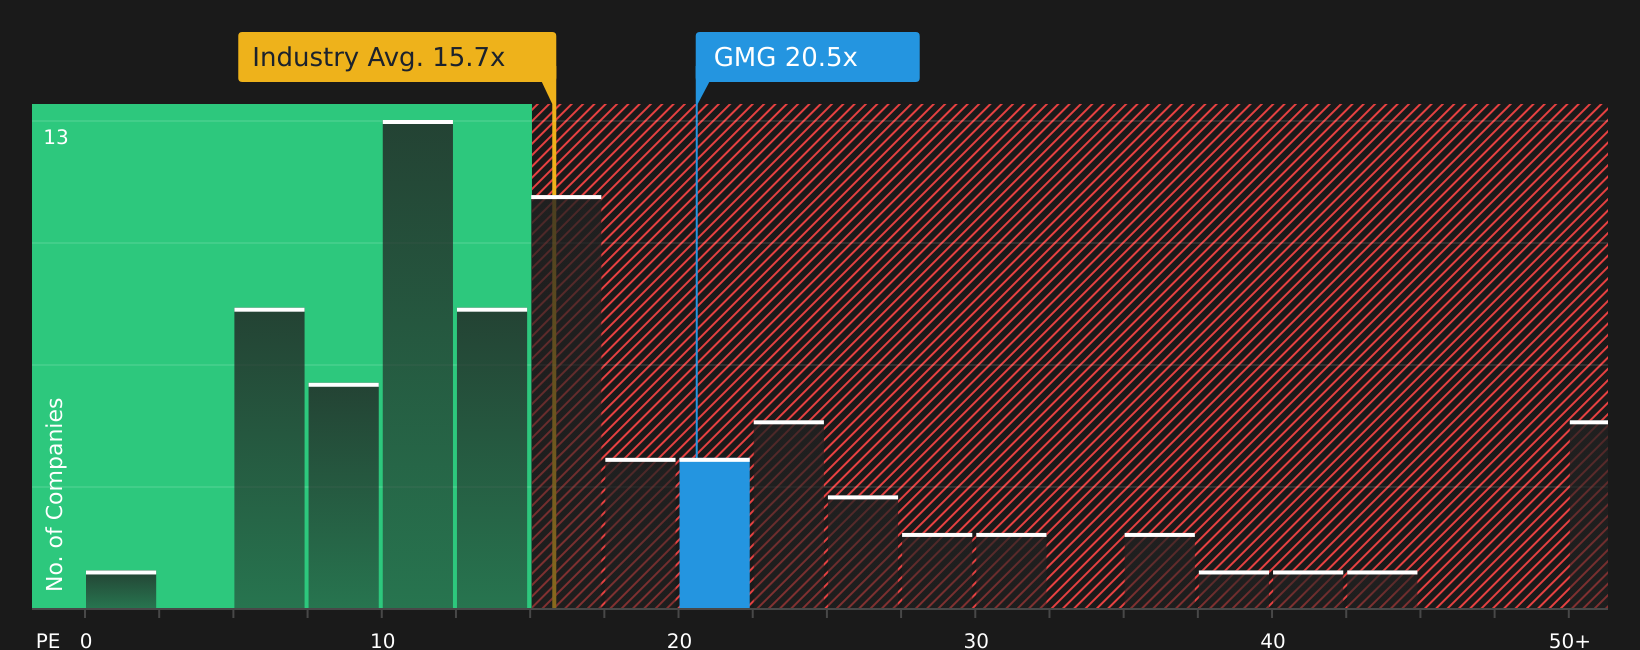
While the SWS DCF model suggests Goodman Group is trading around 20% below fair value, the P/E comparison looks less forgiving. Goodman Group trades on 20.3x earnings versus 12.3x for peers and a fair ratio of 15.5x. That implies investors are already paying a premium, so the key question is how comfortable you are with that valuation.
See what the numbers say about this price — find out in our valuation breakdown.
Next Steps
This mix of optimism and caution around Goodman Group will not stay balanced forever. Review the full data and move quickly to form your own view with the 4 key rewards and 1 important warning sign
Looking for more investment ideas beyond Goodman Group?
Goodman Group gives you plenty to think about, but your portfolio decisions are stronger when you compare it with a wider set of quality opportunities.
- Spot potential bargains early by surveying companies that appear mispriced on quality and value metrics using the 10 high quality undervalued stocks
- Strengthen portfolio resilience by focusing on businesses with robust finances through the solid balance sheet and fundamentals stocks screener (21 results)
- Stay ahead of the crowd by scanning a screener containing 9 high quality undiscovered gems
This article by Simply Wall St is general in nature. We provide commentary based on historical data and analyst forecasts only using an unbiased methodology and our articles are not intended to be financial advice. It does not constitute a recommendation to buy or sell any stock, and does not take account of your objectives, or your financial situation. We aim to bring you long-term focused analysis driven by fundamental data. Note that our analysis may not factor in the latest price-sensitive company announcements or qualitative material. Simply Wall St has no position in any stocks mentioned.
Have feedback on this article? Concerned about the content? Get in touch with us directly. Alternatively, email editorial-team@simplywallst.com