
- PRICING
- LIVE QUOTES
- LEARN
- HELP


EN
Undiscovered Gems in Asia To Watch This August 2026
Amidst the backdrop of fluctuating global markets and economic uncertainties, Asian equities have been navigating a complex landscape influenced by rising oil prices, geopolitical tensions, and mixed economic data. As investors search for opportunities within this dynamic environment, small-cap stocks in Asia present intriguing prospects due to their potential for growth and resilience in diverse market conditions. Identifying promising stocks often involves looking at companies with strong fundamentals, innovative business models, and the ability to adapt to shifting economic trends—qualities that can be particularly appealing during times of broader market volatility.
Top 10 Undiscovered Gems With Strong Fundamentals In Asia
| Name | Debt To Equity | Revenue Growth | Earnings Growth | Health Rating |
|---|---|---|---|---|
| Envipro Holdings | 39.71% | 0.65% | -14.56% | ★★★★★★ |
| Ad-Sol Nissin | NA | 7.22% | 15.60% | ★★★★★★ |
| Chongqing Machinery & Electric | 18.92% | 8.39% | 25.87% | ★★★★★★ |
| Kyosan Electric Manufacturing | 46.17% | 7.20% | 17.51% | ★★★★★★ |
| Forth Smart Service | 44.85% | -3.80% | 10.19% | ★★★★★☆ |
| Zhejiang Jolly PharmaceuticalLTD | 21.31% | 17.83% | 29.70% | ★★★★★☆ |
| uSonar | 5.92% | 15.93% | 37.38% | ★★★★★☆ |
| Dmall | 59.68% | 15.24% | 23.16% | ★★★★★☆ |
| Sing Investments & Finance | 0.10% | 5.85% | 7.00% | ★★★★☆☆ |
| Shengda ResourcesLtd | 57.58% | 8.61% | 9.90% | ★★★☆☆☆ |
We'll examine a selection from our screener results.
Hunan Fangsheng Pharmaceutical (SHSE:603998)
Simply Wall St Value Rating: ★★★★★☆
Overview: Hunan Fangsheng Pharmaceutical Co., Ltd. is involved in the research, development, production, and sale of traditional Chinese medicine and chemical pharmaceutical products in China, with a market capitalization of CN¥4.26 billion.
Operations: Fangsheng Pharmaceutical generates revenue primarily from the sale of traditional Chinese medicine and chemical pharmaceutical products. The company's net profit margin has shown fluctuations, reflecting changes in operational efficiency and cost management.
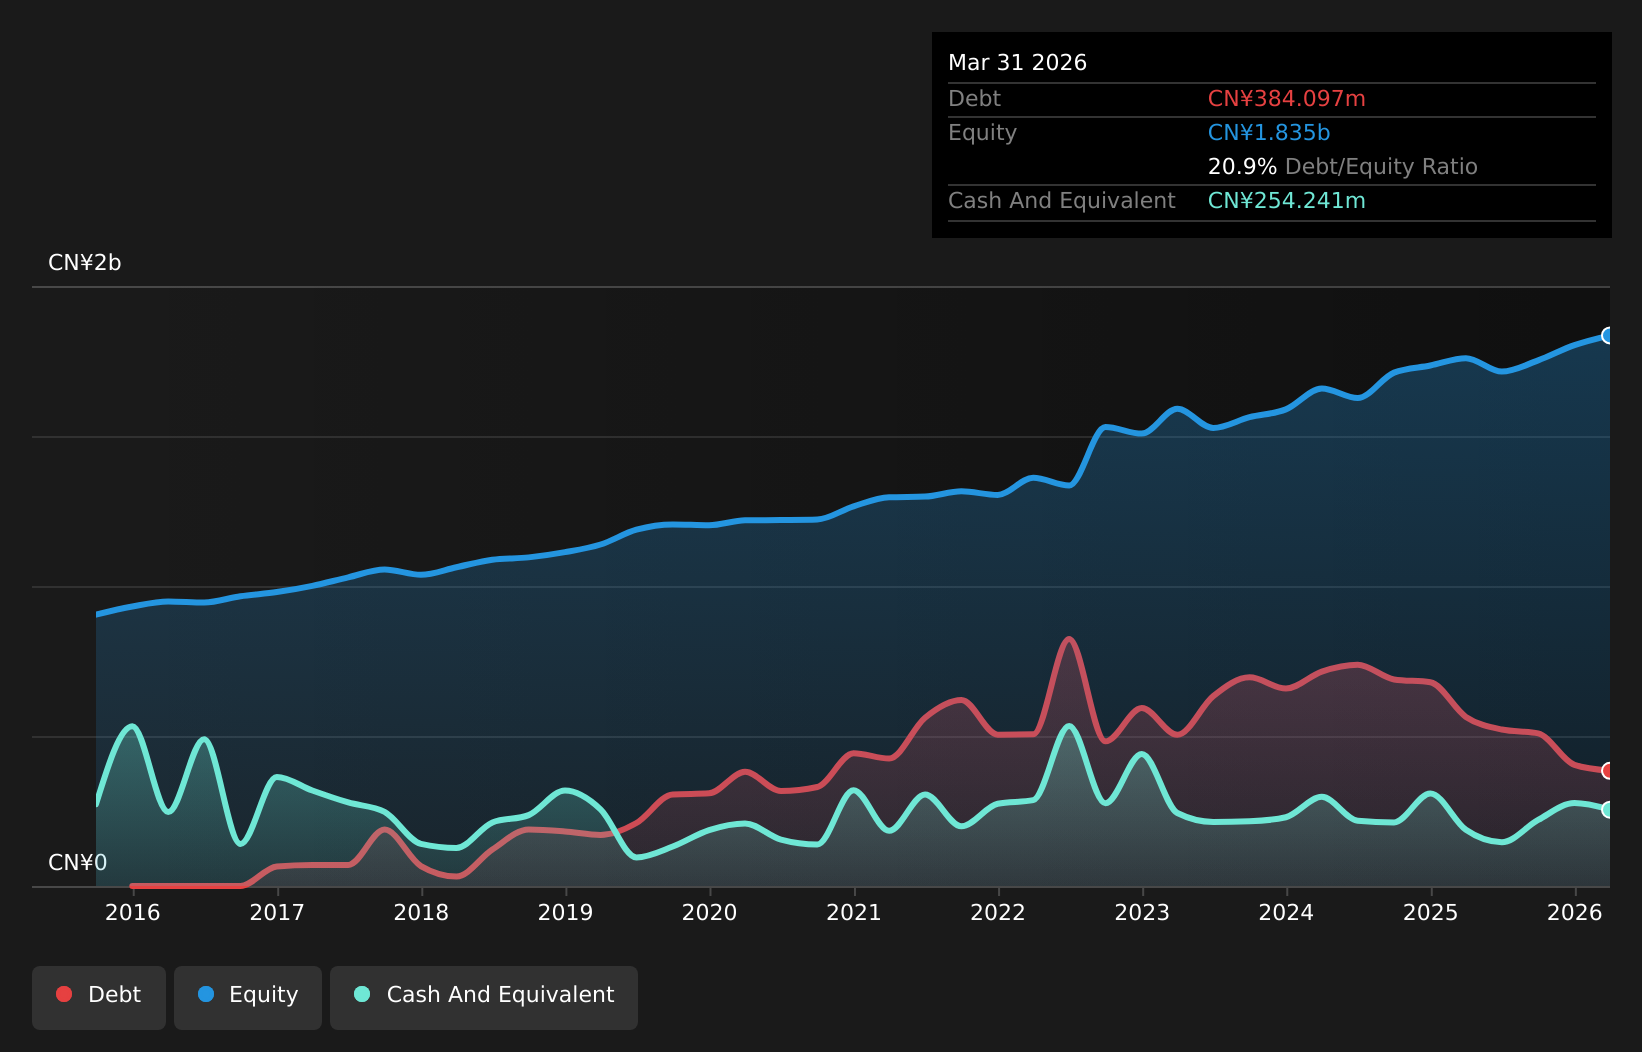
Hunan Fangsheng Pharmaceutical, a promising player in the pharmaceutical sector, has shown notable financial health with earnings growing by 12% over the past year. The company's debt to equity ratio improved from 32.8% to 20.9% over five years, indicating effective management of liabilities. Trading at an impressive 87% below estimated fair value suggests potential for significant upside. Its net debt to equity ratio stands at a satisfactory 7%, and interest payments are well covered by EBIT with a coverage of 44 times. A recent special shareholders meeting indicates active engagement in strategic decision-making for future growth initiatives.
Raytron TechnologyLtd (SHSE:688002)
Simply Wall St Value Rating: ★★★★★☆
Overview: Raytron Technology Co., Ltd. specializes in designing and manufacturing application-specific integrated circuits and special chips, with a market capitalization of CN¥73.22 billion.
Operations: Raytron Technology Co., Ltd. generates revenue primarily from the design and manufacturing of integrated circuits and special chips. The company has a market capitalization of CN¥73.22 billion, reflecting its significant presence in the industry.
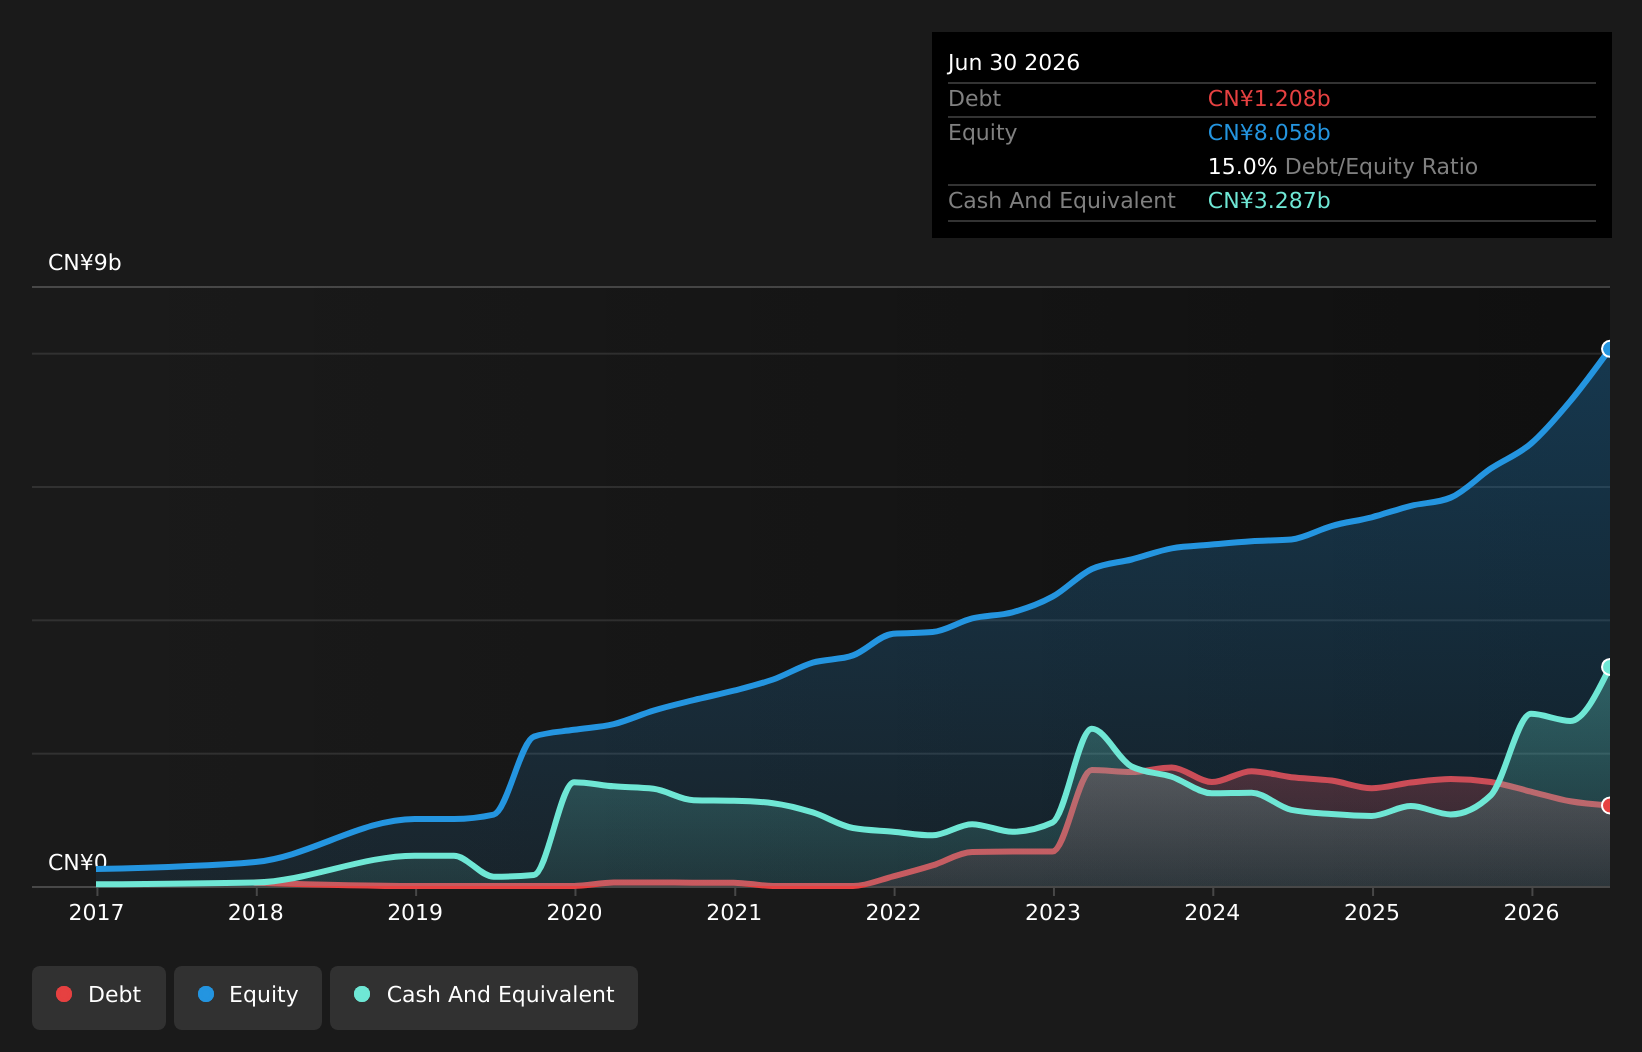
Raytron Technology, a vibrant player in the electronics sector, has seen its earnings skyrocket by 192% over the past year, significantly outpacing the industry average of 10.5%. The company reported impressive half-year sales of CNY 4.34 billion and net income reaching CNY 1.26 billion, up from CNY 351 million last year. Trading at a compelling value—72% below fair estimate—Raytron's financial health is robust with more cash than total debt and interest payments covered an impressive 634 times by EBIT. Despite recent share price volatility, Raytron’s growth prospects remain promising with forecasted annual earnings growth of over 15%.
Vision (TSE:9416)
Simply Wall St Value Rating: ★★★★★☆
Overview: Vision Inc., along with its subsidiaries, primarily provides mobile Wi-Fi router rental services both in Japan and internationally, with a market cap of ¥50.31 billion.
Operations: Vision Inc. generates revenue primarily through mobile Wi-Fi router rental services, with significant operations in both domestic and international markets. The company's market capitalization stands at ¥50.31 billion, reflecting its substantial presence in the telecommunications sector.
Vision's performance has been noteworthy, with earnings growth of 30.6% over the past year, outperforming the Telecom industry average of 17.6%. This growth is supported by a favorable debt position, as Vision holds more cash than its total debt and maintains an interest coverage ratio that surpasses its obligations. Trading at 67% below fair value estimates, Vision appears attractively priced relative to peers. Recent developments include a share buyback of 1.65 million shares for ¥1,706 million and an integration with Concur Expense to streamline expense reporting for corporate travelers using their Global WiFi service in over 170 countries.
- Click here to discover the nuances of Vision with our detailed analytical health report.
Understand Vision's track record by examining our Past report.

Summing It All Up
- Unlock our comprehensive list of 129 Asian Undiscovered Gems With Strong Fundamentals by clicking here.
- Are any of these part of your asset mix? Tap into the analytical power of Simply Wall St's portfolio to get a 360-degree view on how they're shaping up.
- Unlock the power of informed investing with Simply Wall St, your free guide to navigating stock markets worldwide.
Interested In Other Possibilities?
- Explore high-performing small cap companies that haven't yet garnered significant analyst attention.
- Fuel your portfolio with companies showing strong growth potential, backed by optimistic outlooks both from analysts and management.
- Find companies with promising cash flow potential yet trading below their fair value.
This article by Simply Wall St is general in nature. We provide commentary based on historical data and analyst forecasts only using an unbiased methodology and our articles are not intended to be financial advice. It does not constitute a recommendation to buy or sell any stock, and does not take account of your objectives, or your financial situation. We aim to bring you long-term focused analysis driven by fundamental data. Note that our analysis may not factor in the latest price-sensitive company announcements or qualitative material. Simply Wall St has no position in any stocks mentioned.
Have feedback on this article? Concerned about the content? Get in touch with us directly. Alternatively, email editorial-team@simplywallst.com